|
THE GREATEST STOCK MARKET MANIA OF ALL TIME - DATED SEPTEMBER 3, 2010 A SPECIAL REPORT BY ALAN M. NEWMAN, EDITOR CROSSCURRENTS This feature is now published on roughly a quarterly basis. Our next update will likely be published in late December 2010. |
|
Our readership
continues to grow.
This report
is primarily a compilation of articles that have previously appeared in
the Crosscurrents newsletter.
Please check out the testimonials on our Kudos page. Printable
files of this report accompanied by our forecast are available only to
paid subscribers.
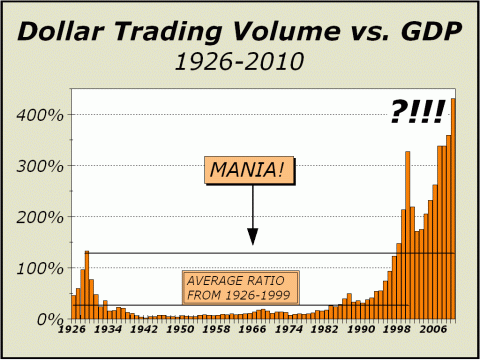
Over the last year, we have complained repeatedly of the problems securing accurate data for Dollar Trading Volume (DTV). There are now so many "exchanges" that collating data has become nearly impossible and additionally, there is every reason to believe that sufficient black box trading off the exchanges muddles the picture significantly. Simply put, there may now be no way to accurately quantify transactional volume. Nevertheless, we are committed to presenting the best view we can for this report, what amounts to a best guess. What we see is staggering and utterly depressing. In the last report, our charts assumed - according to the common wisdom - that the New York Stock Exchange accounted for roughly 25% of all transactional volume. For the basis of this report, we are increasing the denominatorto 30%, since there is no real hard evidence for either percentage. Determining DTV for the New York Stock Exchange is not particularly difficult and below is a link to view the most recent data. From January 1st through July, DTV on the NYSE totaled $11 trillion and at this pace, DTV would total about $18.86 trillion over the course of the year. This is a considerable increase from our last report. As we did last time, we sought confirmation and found same from the BATs exchange. While we only examined a brief history as our sample due to time constraints, we believe the sample is reasonable and infers a decent grasp of the overall picture. Transaction volume has slowed significantly in August, typical of the summer "doldrums" and is expected to pick up again into the autumn. However, even in this slow month, total notional volume (DTV) averaged $200 billion per day. Thus, our estimate places total DTV at a pace approaching $63 trillion for the year. Bear in mind if we used a denominator of 25% for NYSE trading versus our 30% assumption, it would place our DTV estimate at over $75 trillion and would necessitate extending our charts further. Given GDP of $14.6 trillion, DTV is more than 4.3 times GDP, the highest ever (by a wide margin). Using the 25% denominator, DTV would be more than 5 times GDP. Amazingly, the 2000 lunacy and the 2007 bubble echo have been eclipsed. Another record breaking year is in progress.
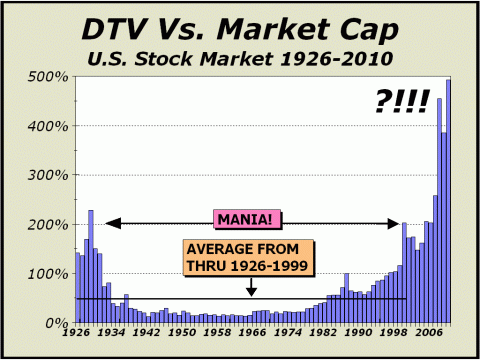
Below, Dollar Trading Volume is measured in relative terms versus total stock market capitalization rather than GDP. Although in the 2000 tech lunacy, DTV fell slightly shy of the manic top in 1929, DTV has since exploded. Over the last four years, beginning with the bubble echo in 2007, the ratio of trading to market cap has simply gone what can only be described as bonkers and is now more than ten times the average ratio from 1926 through 1999! To repeat from our previous report; "the two most significant distinctions in this chart stem from our line marked "MANIA!" After the first occasion, stocks took 26 years to recover. Since the second occasion, a decade has elapsed and prices are still lower. Each tall bar has resulted
in disaster for investors.
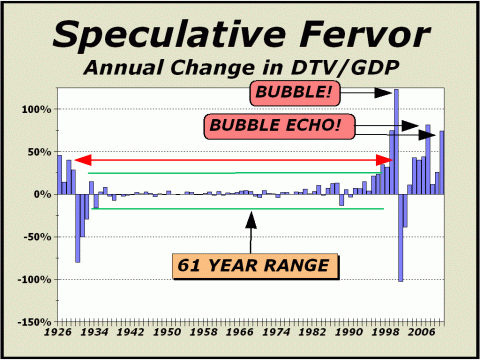
Below, we have not shown Speculative Fervor all that often but clearly, the phenomenal increase in trading this year deserves another perspective. While far shy of the lunacy of 2000, the current echo clearly measures closely with that of 2007 and will likely play out in somewhat similar fashion. As transactional volume increases,
As transactional volume increases,
In the current environment,
From the August 23rd issue
of Crosscurrents:
The following article was the
lead article in our July 26, 2010 issue.
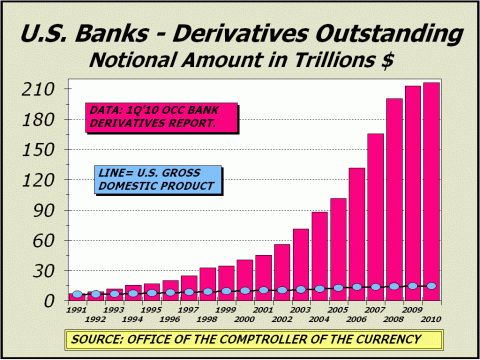
Greenspan Was Wrong, We Were Correct. We last looked at derivatives in the April 5th issue, categorizing the environment as “Not Safe, Not Sound.” Nothing has changed to sway our point of view and in fact, if anything, the world is likely a more dangerous place since notional values of derivatives are still growing at a clip approaching 20% annualized. As of the end of the first quarter, the Office of the Comptroller of the currency (“OCC”) tallied a grand total of $216.5 trillion for commercial banks and an astounding total of $293 trillion when the top 25 bank holding companies were included. These are new records by wide margins and well more than double the tally from the end of 2005. Former Fed Chairman Alan Greenspan assured us for years that rapid growth in derivative products was necessary for sustained robust economic growth. Our position was that the phenomenal increase in notional values was equivalent to risk taking on a scale never seen before, a circumstance that would surely lead to one derivative bust after another. Greenspan was wrong. We were correct. The Crash in 1987 was catalyzed by derivatives in the form of portfolio “insurance” and index arbitrage. Then in 1998, Long Term Capital Management managed money but could not manage risk, increasing their leverage to the breaking point. The markets went against LTCM and their positions imploded. The LTCM daisy chain of derivatives covered fully 6% of all notional values outstanding at the time. Had the Fed and major banks not stepped in to rescue the situation, there would likely have been a total collapse of our financial system. In 2008, there was a similar disaster triggered by credit derivatives and swaps, plus the utilization of extraordinary leverage and in the end, several firms that were household names for generations went the way of the Dodo. Bear Stearns and Lehman Bros. collapsed in spectacular fashion and Merrill Lynch was swallowed up. While the system survived, it did so barely and only as emergency bail out legislation was enacted. Again, Greenspan’s assumptions that derivatives would lead the way to increased economic growth were proved horrendously wrong. In the 15 years leading up to 1994 when derivatives had a far smaller impact, GDP averaged 6.9% growth annualized. In the last 15 years, notional values have grown close to 19% annualized (slightly higher than that over the last five years). Over this period, GDP has nudged ahead at only a 4.7% annualized pace and less than 4% annualized over the last five years. Derivatives have given us slower economic growth and have afforded three spectacular busts. Inevitably, another disaster remains waiting in the wings. Greenspan’s folly is readily visible in our featured chart below. GDP plods on higher in an almost sideways slant while notional values explode. Worldwide, we have seen estimated totals of notional values, including those the OCC is not able to tally, as high as $1.5 quadrillion. While we cannot vouch for the estimate, the Bank for International Settlements tallied $681 trillion at the end of 2007 and the same pace would put us at roughly $1.2 quadrillion at the end of this year. The uncounted amounts are a huge problem. Each contract must have at least one counter party. Derivatives are now so sophisticated, so complex, convoluted and so prevalent that it is virtually impossible to track them all and to quantify the risks to the players. Most disturbingly, as the Goldman Sachs debacle clearly showed, they exist mostly because as financial and mathematical constructs, they are products that can be created, developed and sold.
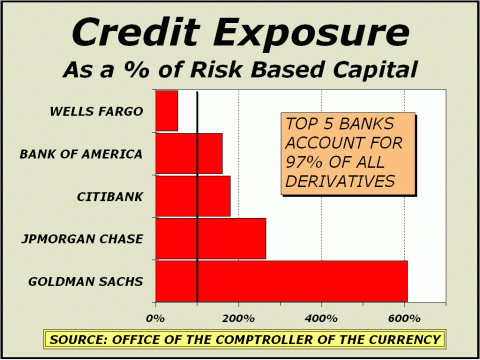
To a large degree, derivatives are alleged to be developed to lay off unwanted exposures or risks. But as we have commented on so many occasions, overall systemic risk is never alleviated in the slightest degree by derivatives. Risk simply passes from one party to another for a price. However, in the final analysis, because so many assumptions are made about reduced exposure to risk, firms wind up taking on far more risk than they can actually wisely accommodate. The proof is in the 2007-2008 debacle. As derivative growth exploded in 2005 (up 30%) and 2006 (up 26%), it didn’t matter one bit how risks were laid off. Everyone was playing the same game and playing it to the hilt. In some cases, leverage reached 30-1 or even higher and eventually, it all had to come apart at the seams. That it took as long as it did to implode had nothing to do with the veracity of the contracts, instead it likely had to do with precisely the opposite; concerted efforts to conceal just how bad things were about to get, in order for certain parties to be able to short the system, placing it on the brink. As seen below, credit exposures as a percentage of risk based capital for our largest banks have grown to astonishing levels. The average for the five largest banks, now 256%, has grown over the years and was recently as high as 324%. Despite our conviction that much of the exposures can be netted to zero, we can easily posit that too much risk is still being assumed. The top five banks account for 96.7% of all derivatives. Bear in mind our front page chart simply shows the tally for insured commercial banks. If we add bank holding companies to the mix, the top five account for $280.2 trillion of a total of $293 trillion in notional values.
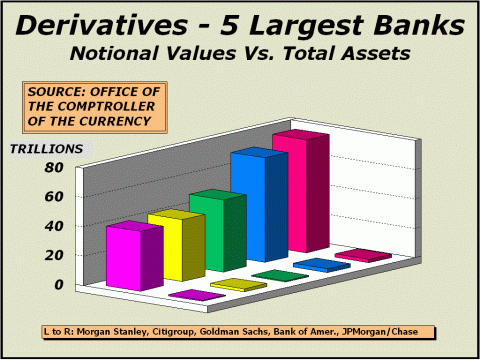
Our next chart now displays the five largest holding companies, rather than the five largest banks, if only to include Morgan Stanley, proprietor of $40.7 trillion in notional values of derivatives.
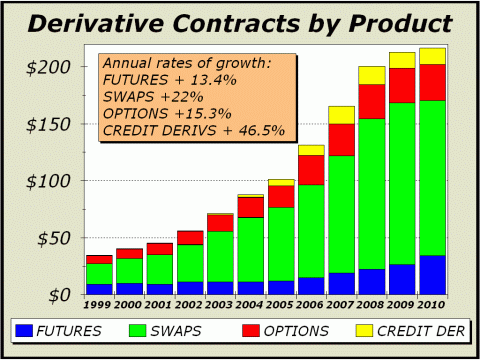
Below, a new chart, illustrating derivative products by type. More than a decade ago, Swaps and credit derivatives were a bit more than half the total but now account for seven of every ten dollars in notional values. Growth in credit derivatives for the period shown is an astounding 46.5% annualized. While swaps and credit derivatives continue to grow at these elevated levels, dangers will continue to accumulate and it will be increasingly difficult and perhaps impossible for our markets to handle the next disaster. Do we have any doubt at all on that score? None, none at all.
From our very first mania report
in January of 1999,
Prior derivative busts are
one of the many reasons
Sadly, derivative implosions remain an ongoing threat.
Below, also reprinted from
the July 26th issue of Crosscurrents.
Metamorphosis Redux. The metamorphosis we have cited as the cause for investor’s woes over the last six years continues unabated and in fact, has worsened considerably with the expanded utilization of high frequency trading (HFT). The “flash crash” of May 6th was a sickening reminder of just how irrelevant the valuations of individual corporate prospects have become. All that counts is the price of shares at the moment, however brief that moment may be. Recently, Sen. Ted Kaufman (D-Del.) said “People are voting with their feet. Why would they not be concerned? We are playing with dynamite here.” If the market can move 10% in mere minutes, trust cannot be forthcoming. The less reliance we place on real decision making by human beings, the more dangerous our stock market will become as purely mechanical factors overtake reason. Zero Hedge’s Tyler Durden recently penned a must read piece (see http://tinyurl.com/37qwpl2) about the effects of “quote stuffing.” The assumption that quote stuffing caused the flash crash and “threatens to destroy the entire market at any moment” should not be dismissed. The evidence provided by certain stocks trading down to mere pennies on May 6th should suffice as a condemnation of HFT. Ironically, we expect the subsequent rules change to institute “circuit breakers” to eventually result in a situation where liquidity dries up even faster than it did on May 6th and therein lies the threat of destruction for our market. HFT is another accident waiting to happen and another dereliction of fiduciary responsibility by HFT participants and regulators. If all goes wrong, they will simply blame it on computers. Humans can no longer make mistakes
but they are able to earn “management” fees
We should also direct your attention to a recent
WSJ article on artificial intelligence (see http://tinyurl.com/2udqe3a),
evidence that we are not learning from our mistakes. As the very
savvy Jim Bianco of Biancoresearch
points out, “Let’s take a look at the checklist
for possible disaster striking on ideas like this:
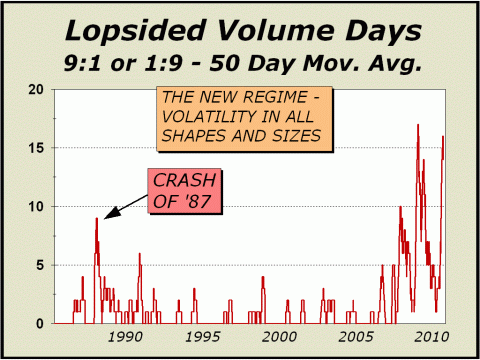
While Rebellion Research’s methodology is not HFT, it is clearly not value investing in the traditional sense either. In fact, the article states that Rebellion “tends to hold stocks for long periods—on average four months.” It is astonishing to read that “long” periods now equate to only four months. At the end of 2009, we estimated that total dollar trading volume had reached $52 trillion versus total stock market capitalization of $13.5 trillion. That would place average hold times overall at 95 days. Thus, Rebellion does indeed hold stocks longer than the average, but not by much. Below, the radicalization of the U.S. stock market is painfully visible and is testament to the alienation of investors. The most recent trip to the top of the chart is the third in less than three years, and all were in excess of the volatility seen when the stock market experienced a veritable crash in 1987. Volatility is not only measured by excess movement in price but can be ascertained by continued whipsaw action, such as we see in our chart. We have chosen a 50-day moving average to allow some element of calm to enter the picture as markets do tend to roil over the short term. Still, in the last two-years-and-change, there is almost no respite for investors and even precious little time to react for traders. In one recent three week period, there were six episodes of manic depressive activity as upside volume swamped the downside twice and downside volume swamped the upside four times.
While 9:1 upside days may seem great to bulls,
Simply put, a sustained resumption of the
upside
Unfortunately, before the bear
market concludes,
WE ALSO COVERED THE ABOVE SUBJECT
IN DEPTH IN THE JUNE 28th ISSUE WITH THREE CHARTS, ONE OF WHICH WE TERMED
OUR CHART OF THE YEAR.
IN THE MAY 19th MANIA REPORT, OUR FINAL ARTICLE WAS TITLED "AN IMPORTANT LONG TERM PERSPECTIVE" TODAY, WE PRESENT..... An Important Short Term Perspective This is all you need to know about the stock market today. The picture below highlights a 5-minute period on May 6th, the day of the so-called "Flash Crash," a chart we showed in the June 7th issue of Crosscurrents. From that issue, we quote in part.... "Despite the best efforts of regulators and the self regulators (read so-called investment banks, brokers and exchanges), no one has any explanation for the five minute journey taken by U.S. stocks on May 6th, shortly before 3pm. If you feel like having your confidence in the system shattered, see the Reuters article at http://tinyurl.com/2a2fbwx and note the comment of Jill Sommers, a CFTC commissioner. When asked if we might never know what happened that day, Sommers opined, “I think that's possible.” We’re satisfied to cite high frequency trading as the likely catalyst and the NY Times story at http://tinyurl.com/29gaulg is certainly grist for the mill, especially this part; “What all high-frequency traders love is volatility — lots of it.” Volatility is the enemy for stocks and equates to the opposite of certainty. May 6th was proof that the liquidity promised by HFT is an illusion and has always been an illusion. The trading abilities of firms such as those mentioned by the NY Times story add nothing to our economic well being."
"Instead, what HFT offers is the inevitable eventuality of an enormous systemic collapse one fateful day as liquidity completely evaporates in the course of milliseconds." "Technology has enabled us to create an environment where financial Frankensteins roam the markets with the potential to wreak havoc." "As we have reiterated so many time before
and will continue to remind readers,
"Don’t look behind you, it is coming. Again."
The long term no longer matters....
To see a free sample copy of the Crosscurrents newsletter, CLICK HERE
*THIS USED TO BE OUR FORECAST SECTION Some of our readers may be aware of a recent "study" of stock market forecasters, published by an internet blogger. In our case, this blog reported accuracy ratings that we can only describe as devised and so far from accurate as to be laughable. Needless to say, our forecasts were interpreted incorrectly and denigrated. We have no desire to direct any traffic to this blog and if you are interested in seeing the "study," you will have to search for it. The blog admits "The Crosscurrents forecasts/targets frequently include qualifications/embellishments that makes testing difficult," yet the ratings were undertaken as if gospel. The blog further admits that "a few very bad forecasts make the average absolute error high." Ironically, and most disturbingly, those very same forecasts begin and end with our initial forecast of a secular bear market bottom at Dow 6400, originally published on our website as far back as 2003 and published in our Washington, DC speech before the International Federation of Technical Analysts in November of 2003. However, as our initially cited time target was pushed out with each new forecast, the aforementioned study considered the entire forecast before it to be utterly wrong and in some cases, awarded us a rating of minus 80% accuracy. That is a stunning misapplication of statistical science, in that the actual bear market low to date was Dow 6469 print basis on March 6, 2009. On a number of occasions, we also specified an SPX low of 680, about as close as one can get to the actual 683 closing low. We not only forecasted the actual price bottom with pinpoint accuracy, we did so six years before the fact. Moreover and most importantly, we have usually cited the upside parameter as "potential" and the downside parameter as "risk," in order to highlight both the best and worst possible cases. The study incorrectly interprets each of these parameters as actual forecasts, which must, by definition, make one or the other of our parameters hopelessly wrong. The market cannot move in both directions at once. If an actual forecast has been issued in the past, it is typically not accompanied by a disclaimer, such as upside "potential" or downside "risk." It has always been accepted wisdom in our business that one does not forecast both price and time together. If a time is specified, never specify a price. If a price is specified, never specify a time. It is sufficiently difficult to forecast one of the two aspects alone. Most forecasters follow this golden rule. When we issue a forecast, we typically do not follow the golden rule. However, the denigration of our forecast results by this faulted study has cast a serious pall on our desire to continue publishing price and time forecasts for the benefit of the public on the free portion of this website. The Crosscurrents website has had more than three-and-a-half million visitors since it was established in 1999 and we are quite proud to display just a few of the many kudos accorded us by readers at http://www.cross-currents.net/kudos.htm. We did not earn these kudos by publishing wrong forecasts time after time. Despite our desire to continue serving the public, we will no longer expose our analysis to faulty studies and inadequate math on the free portion of our website. Therefore, our policy is now changed. While we will continue to publish the very popular Pictures of a Stock Market Mania feature, we will no longer provide any price and time forecasts or parameters as have accompanied this feature in the past. The subscriber portion of our website will have the same article accompanied by price and time forecasts and other parameters as we deem significant, as it always has. If you wish to see these forecasts and or parameters, we suggest you subscribe or purchase a copy of the full article for $20 [CLICK HERE]. THE CONTENTS OF THE ENTIRE WEBSITE ARE COPYRIGHT 2010 CROSSCURRENTS PUBLICATIONS, LLC I hope you have enjoyed your visit. Please return again and feel free to invite your friends to visit as well. Alan M. Newman, September 4, 2010 All information on this website is prepared from data obtained from sources believed reliable, but not guaranteed by us, and is not considered to be all inclusive. Any stocks, sectors or indexes mentioned on this page are not to be construed as buy, sell, hold or short recommendations. This report is for informational and entertainment purposes only. Persons affiliated with Crosscurrents Publications, LLC may be long or short the securities or related options or other derivative securities mentioned in this report. Our perspectives are subject to change without notice. We assume no responsibility or liability for the information contained in this report. No investment or trading advice whatsoever is implied by our commentary, coverage or charts. |
|
|
