|
THE GREATEST STOCK MARKET MANIA OF ALL TIME - DATED OCTOBER 31, 2011 A SPECIAL REPORT BY ALAN M. NEWMAN, EDITOR CROSSCURRENTS This feature is now published on roughly a quarterly basis. Our next update will likely be published in mid-February 2012 |
|
Our readership
is world-wide.
This report
is primarily a compilation of articles that have previously appeared in
the Crosscurrents newsletter.
Please check out the testimonials on our Kudos page. Printable
files of this report accompanied by our forecast are available only to
paid subscribers.
The good news is that we have reduced our earlier estimate of Dollar Trading Volume (DTV) for the U.S. stock market. The bad news is the reduction amounts to the following; instead of the markets being grossly and insanely overwhelmed by high frequency trading, they are now merely grossly and insanely overwhelmed by high frequency trading. The difference between $62 trillion in dollar volume and $56 trillion in dollar volume is inconsequential. The markets can no longer function as an arbiter of fair value for the price of individual companies because holding periods have evaporated. Put another way, if stocks
can be held for as little as a second,
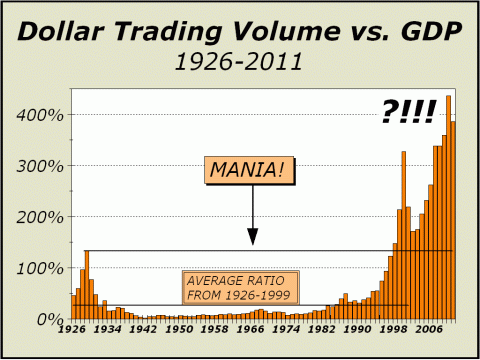
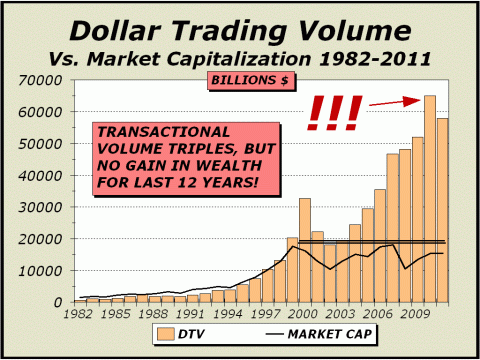
Again, we must admit our statistics for total Dollar Trading Volume (DTV) are not 100% accurate but should not be off by more than a very modest amount. It is likely that a precision tally is not even possible at this point. The BATs exchange data supposedly reports all (see links below) but there is no way to determine if it does indeed capture all trades, a small portion of which we see as likely to be away from any oversight. We repeat from our last report, Wikipedia's article (see http://en.wikipedia.org/wiki/Dark_liquidity) states that so-called Dark Liquidity trades are "....usually visible after the fact in the market's public trade feed" for so-called "Iceberg Orders," but "usually" is the same as "not always." Furthermore, regarding dark pools, the Wiki states that ".... detailed information about the volumes and types of transactions is left to the crossing network to report to clients if they desire and are contractually obligated." Can there be any doubt that some information is withheld? If information can be withheld, some information can be assumed to be withheld. Note that even our newly reduced estimate places total DTV at 386% of the country's entire Gross Domestic Product (GDP). From 1930 to 1998, a 69 year period in which no veritable manias occurred, DTV averaged less than 23% of GDP. Even at the insane peak of 1929, DTV was only 133% of GDP. In 2000, when tech stocks went to the moon (and back) and CNBC became prime time television fare, DTV averaged 328% of GDP. Since then, the public has for the most part, pared back participation significantly. Indeed, over the course of the last six years, mutual fund inflows have been negative. Yet, DTV now stands at 386% of GDP, much higher than in 2000. Why? High Frequency Trading (HFT).
Professional estimates have placed HFT's influence at 73% of all volume as of 2009 and we can fairly assume the percentage is higher today. Possibly significantly higher. While proponents of HFT have claimed many benefits for the markets, especially and including vastly increased liquidity, the proof is in the pudding. There are and will inevitably be times when bids and offers are pulled as uncertainty affects algorithms and during those periods, volatility will increase, causing further uncertainty and affecting more algorithms to the point where there is no liquidity at all. The result is a vacuum. One such vacuum occured on May 6, 2010, wiping out over a $1 trillion in wealth in a matter of a few minutes. It is no wonder that the public wants no part of the stock market. The "benefits" of HFT are not only illusory, they are a total fabrication. They do not exist. For HFT to succeeed, participants must find ways to respond more quickly, or else the competition will and take the advantage. Quote adjustments have now made the leap from milliseconds (one-thousandth of a second) to microseconds (one-millionth of a second) and laughably, we are now at the point where it can be inferred that it is possible for trading to occur at faster than light speeds (see http://bit.ly/nPfX7K). Despite any protestations by HFT proponents, there is no possible way in which recent developments can support any notion that HFT benefits the market, the public, or the fair value pricing of individual companies.
Above: we illustrate the "benefits"
of HFT.
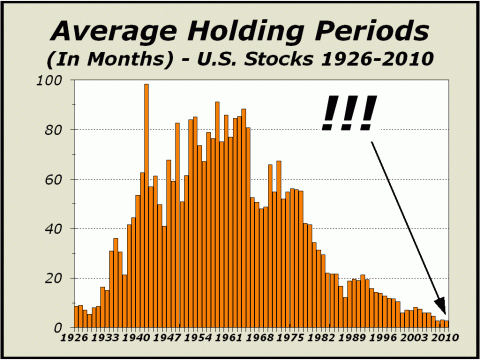
This market observer has been involved in the stock market since 1964 and the most oft heard refrain and sage advice for many years was to "buy for the long term." Over the long haul, stocks should return approximately 5% per annum ex-dividends. If inflation remains under 5%, the nest egg must grow. However, the emphasis has clearly shifted and the theme of investment has been completely replaced by one that focuses almost exclusively on the short term. The average holding period for U.S. stocks is now a little more than three months. The takeaway is a fickle arena, where there can be no loyalty to an inverstment idea, thus good ideas are routinely ignored just as easily as bad ideas.
As a result, all stocks suffer.
Non-HFT trading now amounts
to roughly $15.1 trillion.
The public cannot possibly receive the best price any longer. Our stock market serves only
HFT.
The following article was the lead article in our October 17, 2011 issue. Headlong On The Path To Ruin & Destruction. Never before have we published
an article from our most recent issue on this website,
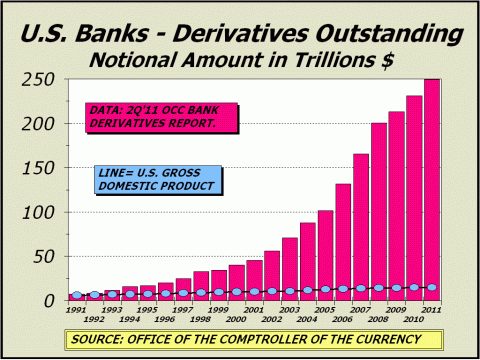
No surprise, we remain convinced that derivatives are the principal cause of the country’s economic ills and likely the world’s as well. Sans the forced and unnecessary creation of a market for derivative crap like the RMBS (residential mortgage backed securities) bundled by banks and later packaged into all kinds of pathetically faulted products, it is nigh unto impossible to discern how so many billions of dollars in mortgages could have ever been available to those who could not possibly afford them or to those who were purposely deluded by salesmen and brokers into accepting terms that had to equate to an eventual default. There, we said it, albeit indirectly. The industry was built upon a house of cards, run by greedy crooks, aided and abetted by a financial industry that only knew one rationale; take advantage, do it now and do it as often as possible. And again, we hasten to remind that no one has yet to go to jail for the frauds perpetrated upon the public and between the housing stock and the stock market, total wealth has evaporated to the tune of at least $10 trillion. We began covering the subject of derivative securities privately after the stock market crash of 1987, and expanded our newsletter coverage dramatically when annualized growth in derivative products began skyrocketing over a decade ago. We predicted on numerous occasions that the reliance on these constructs would eventually and repeatedly wreak havoc on our markets. In December of 2008, we wrote of “The Inevitable Dénouement,” an article that can be viewed at http://www.cross-currents.net/archives/dec08.htm. At the time we forecast a maximum downside of SPX 670 and the actual bottom arrived exactly three months later at SPX 667. Although our maximum downside projection held and still appears to be all the bear wrote, we cannot be certain. Simply put, the continued growth of derivatives places any presumption of outcomes in doubt. In 2003, when we first addressed the possibility of a Dow 6400 bear market bottom target (the actual low was 6469) before the International Federation of Technical Analysts, notional values of derivatives were $70 trillion. Notional values are now $249.3 trillion. That’s almost a quarter-of-a-quadrillion dollars. When was the last time you saw the word “quadrillion” in print?
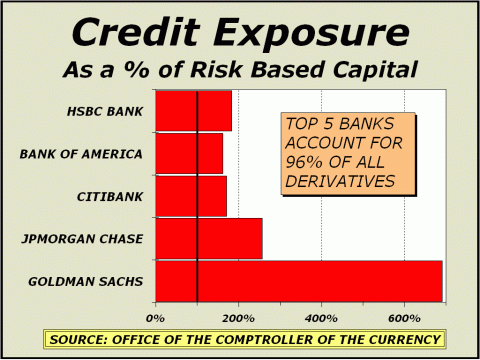
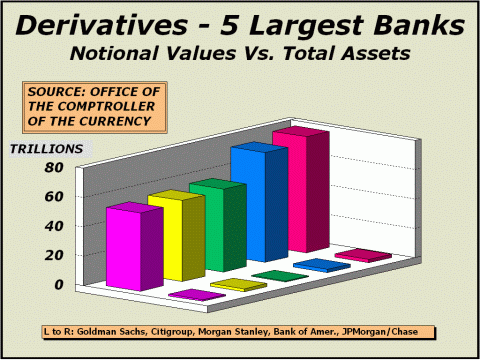
Growth since 2003 is 18.2% per year, a compound rate that must assure the repetition of disaster. Consider the following; just as an asteroid is 100% likely to eventually hit the Earth, every market must eventually face a worst case scenario. When it does, conventional wisdom goes out the window. The success of the derivative markets is highly dependent upon what is termed “netting benefits,” meaning each bank’s exposure to risk is theoretically balanced and almost perfectly hedged. As our prior meltdowns have shown, netting benefits can and will typically evaporate in the blink of an eye. When one big firm makes a bet that proves to be disastrous, it can impact a huge daisy chain extending trillions of dollars, as actually occurred in 1998 with Long Term Capital Management and as occurred in 2008 with several high profile banks and brokers. It will occur again and the iterations are quite likely to arrive at a far more rapid clip as derivative growth continues at this insane rate of growth. It seems every time we show our featured chart, we have to extend it to accommodate the continuing growth in derivatives. The scale has more than doubled in only four-and-a-half years. Notional values are now equivalent to 16.6 times gross domestic product (GDP). Thus far this year, notional values are growing by roughly $144 billion per day, an absolutely mind blowing number when you realize that the nation’s GDP averages only a bit over $41 billion per day. Notional values are now more than 17 times total stock market capitalization. Market cap was higher in mid-1999, over 12 years ago. At the time, notionals were less than $34 trillion, one-eighth of what they are now. Thus, we can easily make the assumption that the country’s focus has all been about derivatives. The stock market is no longer important and began the long road to irrelevance years ago. It is no wonder that another recession is on the horizon for the third time in recent memory, why the unemployment and underemployment rates remain disturbingly high, why job creation remains quite sluggish, why 45 million Americans are on food stamps, why so many are patently dissatisfied with legislators of all stripes and why there is a growing movement that despises the greed that Wall Street has sponsored for so long. Below, we illustrate how credit exposure for the five major banks dwarfs their risk based capital. While some take comfort that the Volker Rule will take some risk out of the overall equation, it is clear that the bank/broker lobby is too powerful and the Plutocrats will have their way. For more on the Volker Rule and Plutocrats, we strongly suggest readers view a brief Paul Krugman NY Times essay at http://nyti.ms/qCrtMy. Worse yet, consider the implosion of Morgan Stanley, cut in half since February, and the attendant speculation that something must be wrong. We can tell you what is wrong. I'll tell you what is wrong. Morgan Stanley's assets are $831 billion. Their derivative portfolio has $56.4 TRILLION in notional values. Not that everything can possibly go wrong, since netting benefits cancel out much of the risk, but that's it. Netting doesn't cut out all of the risk. However, if you light enough matches, there is no question that eventually you will light a fire.
And now, here’s a picture of how assets line up against notional values for the 5 largest bank holding companies. The third and fifth largest are acutely aware of the restrictions the Volker Rule will impose and are now clamoring to change their status (see http://buswk.co/qMKRrb,the epitome of temerity. Now, bear in mind how much taxpayers had to pay to bailout banks for their profligacy. Somewhere north of a trillion dollars. In any event, the Volker Rule is already in the process of being drastically watered down as banks have two years from next July to comply and can request three one-year extensions.
The annual rates of growth for selected types of derivative constructs boggles the mind. Again, consider the paucity of restraints and regulations for this industry and that much of the over-the-counter derivative market is still an unfathomable and unaccountable mystery. We are again headlong on the path to ruin and destruction. America is no longer a country
that manufactures tangible goods,
At current rates of growth,
Hopefully, our economy can survive the inevitable shocks that are sure to occur but we’re not at all confident it will....
Below, an article reprinted
from the May 23rd issue of Crosscurrents.
How's This For Liquidity? The arguments in favor of high frequency trading (HFT) typically begin and end with the assumption that HFT provides liquidity for the stock market. As technology progressed to allow those who used to trade in seconds to shorten their timeframes to hundredths of seconds and then milliseconds, HFT gained in favor. But now, even microseconds are long term in the scheme of things. A reasonable explanation of what HFT is all about can be found at http://tinyurl.com/3wbw8sk. How any of this can possibly help investors is a puzzle. Since much of the HFT activity stems from rebates offered by exchanges such as the NYSE for “supplemental liquidity providers” (SLP), it is no wonder some of the larger banks and brokers can sail through an entire quarter without even one losing day. Simply get in and out at the same price and collect a rebate of $.0015 times 100 million shares and you’ve made $150,000. The algorithms rule. Is it any wonder 73% of all volume is now devoted to HFT and timeframes have compressed to microseconds? The game has grown so profitable that every effort is now made to increase the speed at which trades can be transacted. The situation is so bizarre that HFT computer servers far from New York are nowhere near as valuable as computer servers near New York since electrons cannot move faster than the speed of light. In the HFT game, distance is the enemy.
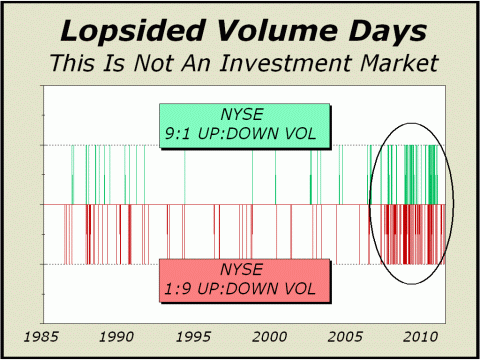
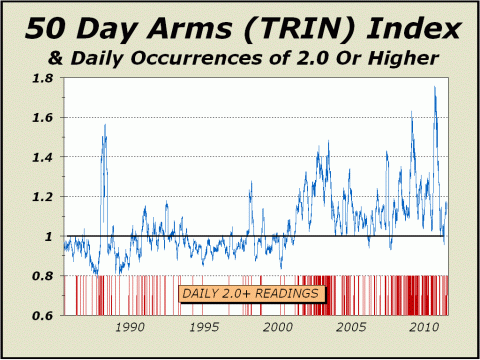
We can now make a fair assumption that much of HFT activity equates to a zero sum game, since rebates ensure profit even when shares are sold for the same price they are purchased. But in a zero sum game, for every winner there must be a loser and in this case, the rebate system likely ensures that the public are the ones taking it on the chin. In any event, May 6th of last year was all the evidence you needed that the system was broken. And while we have not had a 1000 point drop in one hour since, we have had equivalent percentage declines many times over for single stock issues (see http://tinyurl.com/66rnnsl. Below, the pattern of a way too often distressed market is still in view. It is no mere coincidence that HFT has blossomed in recent years just as lopsided volume days have appeared with startling frequency. At center, the TRIN or Arms Index (see http://tinyurl.com/3qdsjol) shows an unmistakable trend towards higher numbers in the HFT era. A glance back to the spike in 1987 is all the more disconcerting when you realize that episode was a veritable and genuine stock market crash. ...And yet the spike was exceeded twice in recent memory.
CHART
DATA UPDATED ONLY THROUGH MAY 23, 2011
One need look no further to
understand why
The stock market is rigged for the benefit of the big boys. Worse yet,
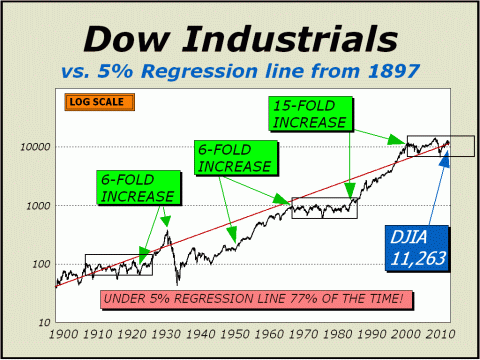
Fair Value For The Dow Over the course of history, the Dow Jones Industrial Averages have put together some fauirly spectacular gains intersperced with several horrific losses and very long periods of sideways movement. The logarithmic chart below accentuates these movements but also illustrates quite clearly that the normal expectation over time is 5% annualized gains, ex-dividends. While stocks can rise dramatically in price, as they have in the three bull markets highlighted by our green labels, the market can resemble sludge for many years at a time, as our three rectangles show. Note all three rectangles are the same length of time and if the current phase is to resemble the first two, it will be another five years before the Dow breaks out above the former highs.
As our regression line clearly illustrates, fair value today for the Dow is 11,263. Fair value is 9% below today's Dow Jones Industrials Average.
To see a free sample copy of the Crosscurrents newsletter, CLICK HERE
The easy answers for us are to restate what we though obvious in our last update; "Although the odds for a full retest of the March 2009 bottom are now quite low (perhaps less than 10%), stocks never fully tested the July 2010 bottom at Dow 9614. The circumstances necessary to once again force another capitulation phase are present and risk now extends to at least the levels of the July 2010 bottom." In essence, nothing has occurred to mitigate our forecast in either direction. At the very least, the continued growth of derivatives presents the same ugly face it did from 2007-2009. It is still quite possible
we are
Upside potential
through remainder of 2011 (same as March update forecast)
Downside risk through
March 2012
Reward/Risk Ratio: Extremely Poor A retest of an eventual of the March 2009 lows is still possible next year. In the
December 2010 update, we said
It did. In the
March 2011 update, we said
It did. For the future, we expect no respite other than quite temporary. We again expect volatility to spike before the end of the year. Volatility is now the normal state of the stock market. THE CONTENTS OF THE ENTIRE WEBSITE ARE COPYRIGHT 2011 CROSSCURRENTS PUBLICATIONS, LLC I hope you have enjoyed your visit. Please return again and feel free to invite your friends to visit as well. Alan M. Newman, October 30, 2011 The entire Crosscurrents website has logged over three-and-a-half million visits. All information on this website is prepared from data obtained from sources believed reliable, but not guaranteed by us, and is not considered to be all inclusive. Any stocks, sectors or indexes mentioned on this page are not to be construed as buy, sell, hold or short recommendations. This report is for informational and entertainment purposes only. Persons affiliated with Crosscurrents Publications, LLC may be long or short the securities or related options or other derivative securities mentioned in this report. Our perspectives are subject to change without notice. We assume no responsibility or liability for the information contained in this report. No investment or trading advice whatsoever is implied by our commentary, coverage or charts. |
|
|
