HOME | SUBSCRIBER SECTION | CHART OF THE MONTH | TECH OUTLOOK | COMMENTARY | LINKS | CONTACT US | ARCHIVES
|
- THE GREATEST STOCK MARKET MANIA OF ALL TIME - DATED NOVEMBER 17, 2015 A SPECIAL REPORT BY ALAN M. NEWMAN, EDITOR CROSSCURRENTS This free feature is now updated only three or four times each year. Our next update will probably be published in early March 2016 |
|
since we first published this website on January 15, 1999. Our readership spans 185 countries.
Our paid
subscription stock market newsletter has only two rationales for its existence;
Please check out the testimonials on our Kudos page. Printable
files of this report accompanied by our forecast are available only to
paid subscribers.
and are chosen for their timeliness and relevance. The Third Concurrence REPRINTED FROM THE JULY 31st ISSUE OF CROSSCURRENTS The new margin data is usually posted at the very end of the month and we must hurry to put together commentary and charts to cover what we see as one of the most troubling developments in decades. We got lucky on July 17th this time, when NASD released their tally which includes both the NYSE’s numbers and their own to give the most accurate picture available. Thus, we’ve had two weeks to study the situation and conclude as you might guess, there are solid parallels with the 2000 peak in tech and the 2007 peak. Make no mistake, this is a veritable stock market mania, the third in 15 years.
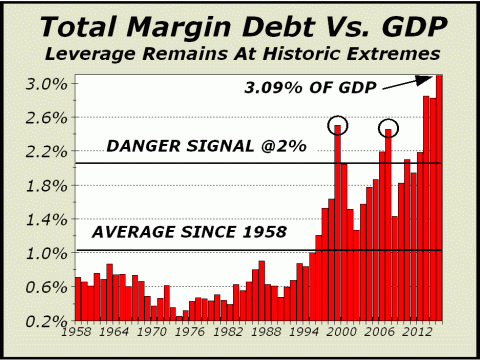
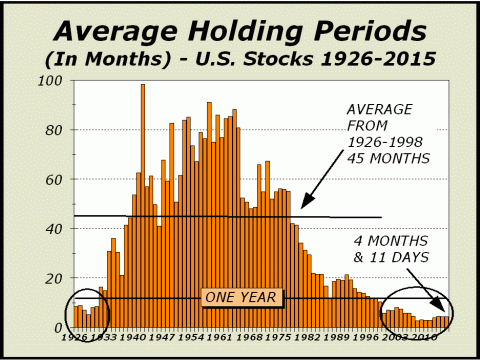
The June margin debt stats fell only $2 billion shy of the April record of $550 billion. The tally represents 3.09% of gross domestic product, the highest since just before the peak in September 1929. The lowest horizontal line on our chart represents the average from 1958 to 1998. By 1999, the tech mania was underway, so our middle line describes a 40 year period of normalcy and 16 years of manic activity. Our Danger Signal line is arbitrary but clearly illustrates elevated risks. Given stock prices were cut in half in two of the worst bear markets ever from 2000-2002 and from 2007-2009, we believe our “danger” appellation is well deserved. At well over 3% of GDP, the current reading likely represents a condition so emphatically excessive that we should expect not only a bear market but possibly a financial crisis to ensue. What are the odds that we are wrong? What are the odds that we have oversimplified the case for danger? What are the odds that stocks could not only continue to maintain this level of margin debt but perhaps, accommodate even more margin debt as prices work their way higher? Clearly, we might have posed the latter question as stocks rose 33% in 1927 or as stocks soared 40% in 1928, well before the September 1929 peak. In each of those instances, stocks kept on rising in an almost straight line to the stratosphere before the bubble burst. The major difference between then and now was you could buy stocks with only 10% down. As long as prices rose, the market became the greatest wealth machine ever invented. All stocks needed to do was rise 10% and a speculator had doubled his money. Take a look at our featured chart again and factor in margin debt at 11% versus GDP at the 1929 peak, as opposed to 3.09% at the end of June 2015. Thus, leverage cannot work the same magic as it did in the Roaring Twenties. We cannot run as fast and as high as then, and we will not fall as far and as fast as then. When the Roaring Twenties bubble finally burst, the crash was far worse than what we witnessed in the bear markets of 2000-2002 and 2007-2009. All that was required in 1929 to completely wipe out a margined speculator was a very ordinary 10% decline in price. So many were wiped out so quickly that the country was plunged into a depression that endured for the better part of a decade. The Dow Industrials fell 89% and the highs of September 1929 were not exceeded for another 26 years. Regulation T now allows only 50% of the value of the position to be purchased with margin. This makes a replay of 1929 impossible. Thus, at this point, we cannot compare the present with the Roaring Twenties. Nevertheless, the circumstances today are dire and have grown progressively worse as margin debt has expanded. At the April peak, total margin debt was 32.1% greater than in 2007 and 83.3% greater than in 2000. The impetus to lever up to record levels despite valuation extremes that have rarely occurred is bizarre. Robert Shiller’s cyclically adjusted price earnings ratio (CAPE) remains near 27, exceeded only in the Roaring Twenties, the tech mania of 2000 and the housing & stock manias of 2007—and Tobin’s Q ratio, which estimates the fair value of the market, is at its third highest level in history. A stock market burdened by excessive leverage is marked by the need for rapid responses to price changes. It is the antithesis of investment. The greater the leverage, the greater the odds that a substantial break in price can catalyze a free fall. Since the threat of downside movement, even tame downside movement, is always present, holding periods contract. Our page one featured chart in the March 20th issue showed holding periods had diminished to four months and 14 days. At bottom left, our updated chart shows holding periods have modestly contracted even further, to four months and 11 days. No one wants to be left holding the bag if the bear ever decides to put in an appearance. More importantly, there is simply no reason to risk longer term positions anymore. The short term has become de rigeur. This also means far less impetus for investors to stay the course. Support is as tenuous as we have ever seen.
However, rather than spook participants as one might think logical, the contractions in holding periods have not only made players more bullish, they are now far less bearish. On page three of the June 29th issue, we showed a two year moving average of Advisory sentiment well above a third standard deviation from the norm, a circumstance that on average occurs less than 0.3% of the time. From December 2002 through December 2013, advisory bears averaged 26.5%. Given stocks typically rise on an annual basis, it is entirely reasonable that bears remain in the minority. But since the beginning of 2014, advisory bears have averaged only 16%, far below the historic norm. The bear case has been so thoroughly discredited by the six year bull market that one might easily infer bears are an endangered species. For much of the bull market, the Rydex Ratio, measuring assets in bull and sector funds versus assets in bear funds, traded between 12:1 to 16:1. Late in 2014, the ratio took off and has since traded as high as 26:1 (now 23.5:1).
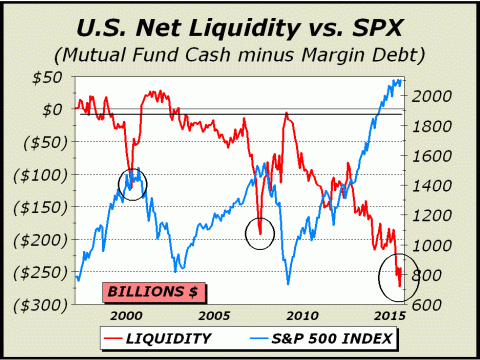
However, as we show here, as a result of the historic changes in behavior of market participants, we now suffer the worst negative liquidity in market history. While there is no readily acceptable and popular indicator for liquidity, we believe our take is reasonable, simply subtracting total margin debt from total mutual fund cash reserves. As a result, net liquidity
reached minus $121.3 billion in March 2000,
Net liquidity reached minus
$192.6 billion in July 2007,
This past April, net liquidity
reached a stunning minus $255 billion
The S&P 500 peaked on May 20th. Given the many technical indicators illustrating negative divergences we are likely witnessing the third concurrence of this indicator; a major peak in stock prices
accompanied by
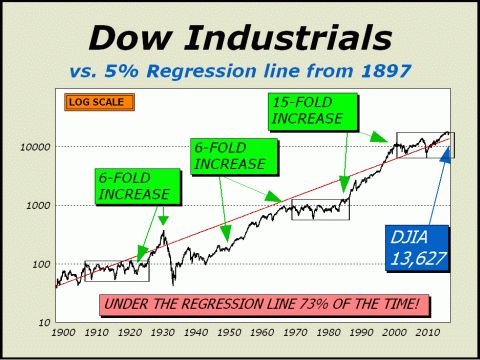
Another Bear Market Target: Dow 13,627 REPRINTED FROM THE SEPTEMBER 28th ISSUE OF CROSSCURRENTS Despite the scary mini collapse from the May 20th all time highs for the major indexes, there is almost no recognition that a new bear market has commenced. The common theme is “correction,” an overused appellation coupled by the financial media to practically any downside burp that might dissuade the little folk from risking more of their dwindling cash reserves on a market of stocks still blatantly overvalued on a historical basis. We refer, of course, to Tobin’s Q ratio and the Shiller 10-year cyclically adjusted P/E ratio (CAPE), which as of the aforementioned all time highs, both illustrated fair comparisons with generational price peaks, exceeded only by the madness in 1929 and 2000. While both measures have now declined modestly, they remain at levels consistent with major long term price reversals for stocks. We have attempted to find a reasonable downside target that when achieved, might again turn our view to the bull side. It may appear that we have been permabears but nothing could be further from the truth. There have been many points in the past at which we beat the drum for stocks, most notably August 1982, December 1987, January 1990 and even in March 2009. Our goal here is to at least have some idea how the downside plays in order to position and prepare for the next bull market.
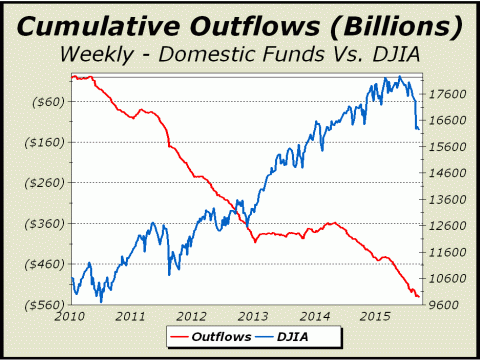
One of many methods we use to gauge downside potential is our regression line chart shown above. In a speech to the International Federation of Technical Analysts (IFTA) in Washington, D.C. on November 8, 2003, we first laid out the case for an eventual long term bear market target of Dow 6400 and SPX 680 six years before the fact. The actual lows were 6469 and 666 respectively. How was a 6400 target even considered reasonable? At the time of the speech, our regression line was at Dow 7629 but appeared perfectly within reasonable bounds. The fact is the regression line has held nearly three-quarters of all action for well over a century. For decades, it was reasonable to conclude 5% annualized rates of gain for stocks, rather than the outlandish gains brought about by stock manias. Our actual Dow target was refined by other methods but was made possible by this chart. Our charting methodology dealing with support and resistance zones currently affords a bear market downside target of Dow 14,719, which is simply the October 9, 2013 print low, a level that should represent considerable support. The good news? It is highly doubtful that the March 2009 lows will ever be seen again. The bad news is that lower targets than Dow 14,719 are both possible and reasonable. Consider our regression line, currently at Dow 13,627, down 16.1% from here and down 25.7% from the all time highs. Of course, this line rises over time and will reside at Dow 14,308 one year from today. Our premise is that 5% annualized average gains for the Dow are an entirely plausible scenario for the long term. However, as our chart implies, as often as not, it would also be reasonable to see the Dow trade well under the line at some point. Thus, even lower targets are not unreasonable. Given that the public seems about as divorced from stocks as they have been for many years, the evidence implies this particular mania is institutionally driven, rather than sponsored by a foolish public. Clearly, Joe and Jane Stockholder have not been active. As we illustrate at lower left, we have seen a steady outflow totaling $540 billion from domestic mutual funds over the last five years. From the beginning of 2007, our monthly stats show outflows of $702 billion. The picture does not change when we factor in Exchange Traded Funds (ETFs), which account for only one-sixth of the assets in domestic mutual funds. The outflows are unlike any seen before in stock market history and are outrageous indictments of the metamorphosis of Wall Street from a veritable forum of investment to a circus of short term trading in which institutions can and will front run the public every chance they get.
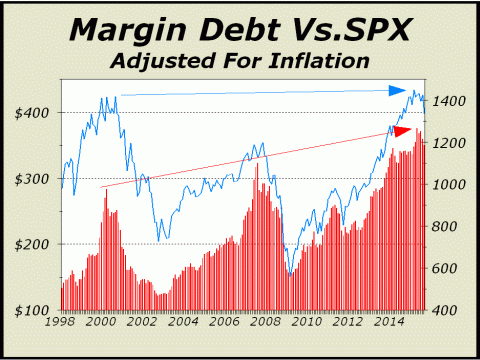
The current metamorphosis into a primarily institutionally driven arena is not entirely without precedent. In 1972, institutional Groupthink gave us the “Nifty-Fifty,” an elite class of stock that was assured to be one decision only—buy. Consequently, prices skyrocketed for only the select few. One study showed that between 1965 to 1972, 18 companies with an average P/E of 47 accounted for virtually all of the S&P’s gains in that period. The same dynamic exists today, which we have illustrated in our negative divergences charts over recent months. As the broader market underperformed, any slack in the index was reinforced by a relative handful of companies trading at insane valuations, such as Netflix (NFLX) with a forward P/E of 320 and Amazon (AMZN) with a forward P/E of 112. However, despite the institutional similarities to the Nifty-Fifty era, the present environment is set apart as never before as margin debt has soared repeatedly to record setting levels. Below, we have adjusted margin debt totals and the S&P 500 for the effects of inflation to better illustrate what is at work. Ironically, the new highs for the S&P 500 have been a bit illusory. The record achieved in May 2015 is actually only one-percent higher than achieved in August 2000. The broad based S&P 500 has gone nowhere for 15 years, whereas margin debt climbed over 51% on an inflation adjusted basis. Without the support from borrowed monies, there is no way the bull market would have looked the same. And based as it has been on borrowed money, the end is likely to be uglier than expected. As shown in our featured chart at center, net liquidity continues to lag at record negative levels.
This circumstance is pivotal in determining both the depth and endurance of the bear market. While we have offered relatively modestly lower bear market targets of Dow 14,719 (down 20% from the high) and Dow 13,627 (down 26% from the high), we are forced to admit there is potential for greater damage. At important bottoms in the past, so much had accumulated in the mutual fund cash reserves category that the upside was almost automatic. However, the absolute level of cash reserves has gone nowhere for over a year and the relative level of cash reserves is the lowest of all time. If we are to rely on the public to turn around a bear market, the wait may require a great deal of patience. We will monitor our indicators closely for significant changes. For starters, we would hope to see net liquidity better than negative $200 billion and mutual fund cash reserves over 4% of assets, a level last seen in August 2012. Valuations must shift to a far more favorable stance as well. We would hope to see the P/E of the S&P 500, still way too high at 19.7, down to 15 or lower. We would also hope to see the dividend yield at 2.25%, at a more rewarding level of 3% of higher. For now, we firmly believe we are in the grip of a new bear market. There will be a lot more pain before we see any gain of note.
An Investor's Worst Enemy
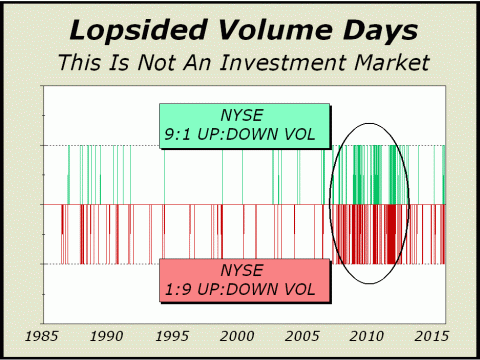
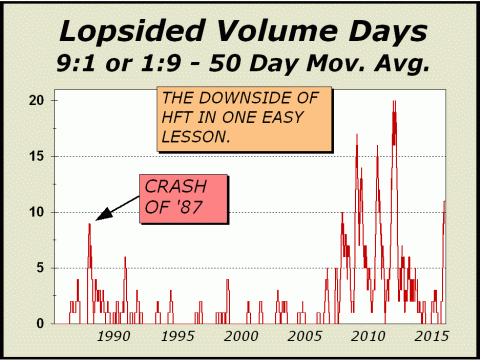
The metamorphosis from an investment market to an arena controlled by mechanical means is also exemplified by the proliferation of wild swings for daily trading sessions. It doesn’t matter much if we look at just the good days as opposed to the bad days simply because volatility is never an investor’s friend. As we illustrate in our charts at bottom left and bottom right, lopsided sessions do not give investors any chance to prepare or act. Mechanical strategies tend to resemble one another, thus we typically see a pile-on effect in one direction or the other. Not quite Groupthink, but let’s think of it as Groupspeed, in which the biggest winners are the fastest, the traders who can position in less milliseconds than others. This is precisely the kind of environment that investors cannot tolerate, even when it is a big day to the upside. Investors need time to react as they ask themselves if they should wait for a pullback or just blindly pile on. From day one on our chart below through all of 2007, a span of 23 years, lopsided volume days occurred only 1.9% of the time. During the terrible bear market that ended in March 2009, lopsided volume days occurred 15.4% of all sessions. Not by any means a fit arena for man or beast, only machines and their algorithms. And since the end of the bear market, although we see a relative lull on our chart, lopsided sessions still occur 9.7% of the time, sufficient to keep investors away, lest they stumble into one of those periods where heads can only spin, rather than react. Also below, this slightly different perspective may be a better picture of the effects of high frequency trading (HFT). Again, our point is that wild swings offer no solace to investors, thus they will avoid the arena, rather than participate. This is one of the principle reasons why domestic mutual funds have suffered such enormous outflows in recent years.
Volatility is anathema and an investor’s worst enemy. Note that this most recent decline in prices is accompanied by a surge in the 50-day average of lopsided days that is now actually in excess of the Crash of ’87. The character of the stock
market has dramatically
We Got It Right Again
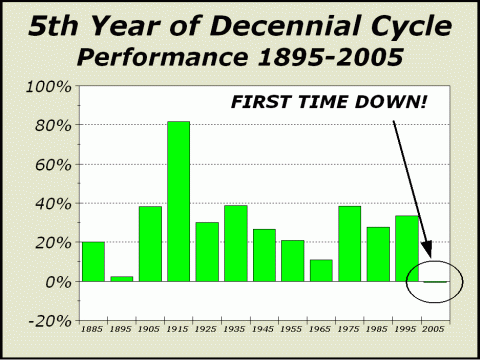
When 2005 was about to commence, the common theme was that it was a can’t miss year. After all, every year ending in “5” dating back to 1885 had been positive and most had been super. The average gain was a phenomenal 30.7%. A veritable guarantee, no? Well, no. We felt differently and clearly went against the common wisdom, calling for a rather drastic change in behavior in 2005 and last December, we did the same for 2015, even though most analysts were still stuck on the goodness of years ending in “5.” See our December 29, 2014 issue at http://www.cross-currents.net/m122914i.pdf for a reminder of what we saw ahead for 2015. Again, so far, we’ve been right on track and virtually the only analysis that has called the year correctly. We are down roughly 1500 Dow points for the year and although we have not yet fallen 20% as expected, we fell as much as 16.2% into the August low.
No one else we are aware of
has been anywhere near as accurate
OUR BEAR MARKET TARGET REMAINS DOW 14,719 WE STILL
HAVE LOWER TARGETS AS POSSIBILITIES:
We also believe the March 2009 low of Dow 6469 will likely never be seen again.
THE CONTENTS OF THE ENTIRE WEBSITE ARE COPYRIGHT 2015 CROSSCURRENTS PUBLICATIONS, LLC I hope you have enjoyed your visit. Please return again and feel free to invite your friends to visit as well. Alan M. Newman, November 17, 2015 The entire Crosscurrents website has logged four million visits. All information on this website is prepared from data obtained from sources believed reliable, but not guaranteed by us, and is not considered to be all inclusive. Any stocks, sectors or indexes mentioned on this page are not to be construed as buy, sell, hold or short recommendations. This report is for informational and entertainment purposes only. Persons affiliated with Crosscurrents Publications, LLC may be long or short the securities or related options or other derivative securities mentioned in this report. Our perspectives are subject to change without notice. We assume no responsibility or liability for the information contained in this report. No investment or trading advice whatsoever is implied by our commentary, coverage or charts. |
|
|
