HOME | SUBSCRIBER SECTION | CHART OF THE MONTH | TECH OUTLOOK | COMMENTARY | LINKS | CONTACT US | ARCHIVES
|
- THE GREATEST STOCK MARKET MANIA
OF ALL TIME -
DATED NOVEMBER 9, 2014 A SPECIAL REPORT BY ALAN M. NEWMAN, EDITOR CROSSCURRENTS This free feature is now updated only three or four times each year. Our next update will probably not be published until the end of February or early March 2015 |
|
since we first published this website on January 15, 1999. Our readership spans 185 countries.
Our paid
subscription stock market newsletter has only two rationales for its existence;
Please check out the testimonials on our Kudos page. Printable
files of this report accompanied by our forecast are available only to
paid subscribers.
and are chosen for their timeliness and relevance. A Recipe For Disaster. REPRINTED FROM THE JULY 30th
ISSUE OF CROSSCURRENTS
Through June, net liquidity improved modestly from the February low, as total margin debt hit a new record high and mutual fund cash reserves modestly improved. However, improvement is a relative term and in this case, only means the indicator has previously been worse. Since 1929, we have seen more negative readings only in the five months before June and in July 2007, three months before one of the most historic peaks in stock market history. While the major averages have not yet turned down as they have before with net liquidity bottoms in 2000 and 2007, we do not see present action as a positive divergence.
The key to persistent price gains has been the Federal Reserves policy to keep the printing press rolling 24/7. This was not a factor at the previous market peaks, so we believe the top has only been delayed, rather than forfeit to continued accommodation. Clearly, the peak in the mania that concluded in 2000 proved the concept that no price is too high cannot possibly work. Eventually, there must be a reaction and the impulse to sell dominates completely. We identified that trigger in late 1999 and early 2000, and correctly predicted that Nasdaq would crash by one-third in only six weeks. As well, the peak in 2007 offered proof that an over leveraged market entertains so much systemic risk that a correction is inevitable, simply to bring risk exposures back to a more sustainable point. We correctly identified that trigger as well, and were only a few points off on our forecasted bear market bottom. We have focused on the problem of derivative exposures for major U.S. banks for years. The trigger for the present phase will likely be a combination of circumstances, including massive overvaluation and risk exposures. In recent issues, we have cited the charts of several major U.S. banks, noting indications of stress that imply the potential for trouble immediately ahead (see page three, Something Is Amiss, June 29th issue of Crosscurrents). Current circumstances are so bizarre that we are convinced a major stock market peak is unfolding, one that will require yet another horrible bear market to correct the excesses that have built during this five and one-third year run. Our featured chart is only one perspective of many. The second chart is every bit as startling and informative. It deserves to be on the front page of every newspaper as an alert to investors that risks have never been higher in their lifetimes. Why this information should be treated as so esoteric that it is undeserving of exposure is puzzling. We have even yet to see this perspective anywhere in the financial press, despite the extent of this extraordinary situation. Margin debt versus GDP has been higher only once, in 1929, when stocks could be purchased for as little as 10%, with 90% borrowed money. The Federal Reserve Boards Regulation T has limited leverage to 50%, meaning an equal amount of borrowed money since 1974. In 1929, even an ordinary stock market correction of 10%, a circumstance that occurs every 1.44 years on average, would wipe out margin players. The 1929 Crash was inevitable. A simple correction was the catalyst for the cascade of losses that occurred. Excess leverage in 2000 and 2007 had a lesser but similar effect. An ordinary 10% correction would mean a 20% erasure of wealth. A 25% bear market, the kind of circumstance that historically takes place every 5.8 years on average, would erase half of ones wealth. Thus, the impetus for collapses as we suffered from 200-2002 and from 2007-2009 were also inevitable. The Federal Reserve was responsible for both the previous manias and their collapse by continuing margin requirements at 50%. Looking again at both our featured charts, it is no wonder we see the possibility of an identical resolution. At the very least, a correction of 25% is inevitable. Paradoxically, the inevitability of any corrective price action no longer seems to have any ability to inhibit participants from piling on. The persistence of price gains in this last leg of the bull market, has totally convinced players that higher prices must follow. Over the last six week, 60.8% of newsletter writers according to the Investors intelligence survey, are bulls, a circumstance we have never seen before. Only 16.4% are bears. The ratio of total assets in Rydex bull and sector funds to bear funds is 18.4, the highest level we have ever seen, another indication that participants are unconcerned about the possibility of correction. We believe the Federal Reserves policy of extreme accommodation to create wealth has not only not had the desired effect of aiding the economy, it has increased systemic risk to insane levels. Despite low interest rates, the argument where else can you put your money? does not hold water when valuations run to historic extremes. This chart of Tobins Q Ratio is from Doug Shorts Advisor Perspectives website, a must visit at http://bit.ly/1fdSat2. Six different perspectives are shown of Tobins Q Ratio to reinforce the evidence of overvaluation for U.S. stocks. We have shown both Tobins Q Ratio and Shillers P/E several times in the last year. The Shiller P/E is at its third highest reading in history. Tobins Q Ratio is at its second highest reading in history. Along with sentiment measures at extremes not seen in many years, we have all the right circumstances for another bear market along the lines of the previous two from 2000-2002 and 2007-2009. Its as if a seven year cycle of madness was in effect.
Kate Welling interviewed Andrew Smithers in her new issue of Welling on Wall St., the number one source for interviews of Wall Streets best minds. Smithers has featured Tobins Q and Cyclically Adjusted P/E (CAPE) in his analysis for years and he believes U.S. stocks are now overvalued by 80%. Furthermore, the billions in share buybacks by U.S. corporations in recent years has taken place at hugely overvalued levels and has been leveraged as well. The contraction in shares has aided earnings, which has made executive option plans a gold mine but has also increased systemic risk substantially. Clearly, the Federal Reserves policy has left much to be desired. Below, this chart presented on Bill McBrides Calculated Risk must read blog (http://www.calculatedriskblog.com/) illustrates just how ineffective Fed policy has been. While job losses have finally returned to the zero line, we must factor in that much of the regained losses are now part time. Even more pertinent is the recovery has not kept up with an expanding population; 7 million more jobs are needed to keep up with population growth.
U.S. corporations have lost
touch with reality.
The country is leveraged to the hilt. This is not a recipe for a continuing bull market. It is instead, a recipe for disaster.
Retail Sector Threatened. REPRINTED FROM THE JULY 30th
ISSUE OF CROSSCURRENTS
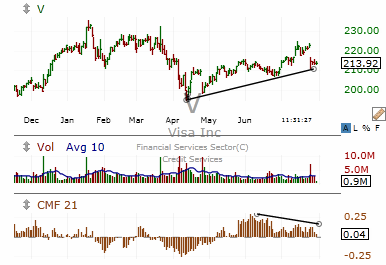
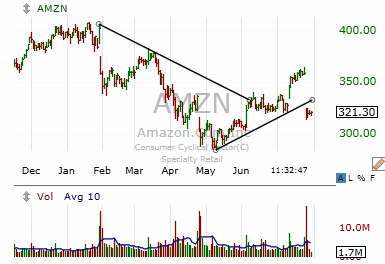
In the January 30th issue (www.cross-currents.net/i013014b.pdfpage 3), we offered reasons why the retail sector and the economy were under pressure and likely to remain threatened. We briefly followed up in the March 30th issue (www.cross-currents.net/b033014y.pdfpage 4). The situation has not improved. The evidence we see strongly implies the U.S. is headed for recession and we would be quite surprised if second quarter GDP figures come in anywhere near expectations, especially when revisions are released. Consumer spending accounts for more than two-thirds of GDP and retail sales account for roughly 35% of GDP. It is increasingly clear that consumers are not spending. Its much worse than you realize. From the Urban Institute (see http://urbn.is/1l9VFTp), Roughly 77 million Americans, or 35 percent of adults with a credit file, have a report of debt in collections. We have been a leveraged society for decades and we are at the end of the rope. Below, we have chosen Visa (V) and Amazon (AMZN) as representative of the troubles we see ahead for the economy. Visa is now down 8.8% from the January high and Mastercard (MA) is off 10.6%. While there are indeed a few retailer charts that look decent, such as Walgreens (WAG), the vast majority scored their highs months ago and are indicative of trouble ahead. Walmart (WMT) is the nations largest retailer with $476 billion in sales but has put in a series of lower highs since early December and shows no signs of turning to the upside at this juncture. Amazons price action is now a disaster in the making, down 20.5% from the January 21st high. We have previously panned the shares several times going back many months and most recently we beat the bear drum in the March 30th issue at $338.29. We were looking for a test of $300 and the stock promptly flopped 16% to $284.38 by May 9th. Last Fridays one day 9.6% collapse on huge volume after a countertrend rally is most disturbing. At todays lower price level, AMZN is trading at a incredibly massive estimated forward P/E of 150.
Neither of the charts should be possible if the economy was expanding at anywhere near the estimates the government or economists have provided. While there are indeed winners, such as WAG previously mentioned, there are a number of very key stocks such as the two below, plus WMT and MA previously mentioned. The list is longer but we focus on the two below to prove our point. Visa (V) has come right back to a trend line established in mid-April but the lower high and gap down move last Friday on huge volume are indelible signs of protracted weakness to come. There should be very strong resistance at $225 and we would not be surprised to see an eventual break of the April low. Amazon (AMZN) has completely invalidated the counter trend rally from the May low and given the shares have always been only a matter of faith, any disappointment in GDP numbers may be enough to take the shares to support between $240-$280. We would expect the entire retail sector to show similar signs of distress eventually. Note: Over the next two-and-a-half months, Visa fell 8.6% but has since rallied quite strongly. Amazon continues lower and recently was off 11.6% from our July analysis. Return To The Average. REPRINTED FROM THE JULY 30th
ISSUE
We expect annualized returns over 20 year periods to eventually return to the long term average of 5% just as they have for 10 year periods. And yes, they could eventually return to zero as they have multiple times in the past. This circumstance can be achieved in many ways, with a combination of lower prices and the passage of time. Buying or holding stocks for the long term at this point in time is quite likely to be an extremely poor investment decision. Our bear market target of Dow 12,471 remains valid.
"Bears Are Nearly Extinct." REPRINTED FROM THE JULY 30th
ISSUE OF CROSSCURRENTS
From every aspect, sentiment is as one sided as we have seen in 50 years of observation. We previously cited assets in Rydex bull and sector funds at over 18 times assets in bear funds and we have shown our own proprietary measures on this page for months at the highest level of optimism we have ever measured but the most significant takeaway is not the extremely high levels of optimism but the extremely low levels of pessimism. The persistence of price gains has completely obliterated the bear camp.
Above, the three-week moving average of bears amongst newsletter writers is again near multi-decade lows. Over the nearly dozen years, there have been only 26 times the three-week average was lower and 16 of those have taken place since November 2013. Bears are nearly extinct.
EVENTUAL
CORRECTION TARGET REMAINS DOW 14,719
The good news is that the March 2009 low of Dow 6469 will likely never be seen again.
THE CONTENTS OF THE ENTIRE WEBSITE ARE COPYRIGHT 2014 CROSSCURRENTS PUBLICATIONS, LLC I hope you have enjoyed your visit. Please return again and feel free to invite your friends to visit as well. Alan M. Newman, November 9, 2014 The entire Crosscurrents website has logged nearly 4 million visits. All information on this website is prepared from data obtained from sources believed reliable, but not guaranteed by us, and is not considered to be all inclusive. Any stocks, sectors or indexes mentioned on this page are not to be construed as buy, sell, hold or short recommendations. This report is for informational and entertainment purposes only. Persons affiliated with Crosscurrents Publications, LLC may be long or short the securities or related options or other derivative securities mentioned in this report. Our perspectives are subject to change without notice. We assume no responsibility or liability for the information contained in this report. No investment or trading advice whatsoever is implied by our commentary, coverage or charts. |
|
|