|
- THE GREATEST STOCK MARKET MANIA OF ALL TIME - DATED NOVEMBER 5, 2013 A SPECIAL REPORT BY ALAN M. NEWMAN, EDITOR CROSSCURRENTS This free feature is now updated only three or four times each year. Our next update will probably not be published until late February or early March 2014 |
|
Our readership
is world-wide.
This report
is foremost a compilation of articles that have previously appeared in
the Crosscurrents newsletter.
Please check out the testimonials on our Kudos page. Printable
files of this report accompanied by our forecast are available only to
paid subscribers.
DON'T
FEEL LIKE COMMITTING TO A LONGER TERM? SPECIAL 4-ISSUE (apx. 3 months)
SUBSCRIPTION OFFER:
The Federal Reserve's concerted action continues to induce a rally in stocks that has endured for far longer than we believed it would. However, the Fed's goal to create and build wealth has not been achieved. If it had, we would be in the midst of a boom and jobs would be plentiful. We predicted the Fed would not "taper" and they have not. However, we are now in a lose-lose situation. If the Fed tapers at any point, stocks will be crushed. If the Fed does not taper, stocks will eventually reach such unsustainable levels that a crash will be the most likely scenario. Dollar Trading Volume (DTV) is on track to register its third highest reading in stock market history. After the peak of $65 trillion in 2010, DTV fell to $63.5 trillion in 2011 and to only $52.7 trillion last year but is now roaring along at a pace that will take it to nearly $56.7 trillion this year. The business of the nation is no longer steel, no longer cars, no longer manufacturing at all. It is no longer computers nor semi-conductors. And even though health care costs now approach 17% of our gross domestic product (GDP), nothing comes remotely close to the business of stocks. At the current rate, transactional velocity as represented by DTV amounts to more than 2.8 times total stock market capitalization and nearly 3.5 times our GDP. Every day, the economy generates an average of roughly $45 billion in business. During the holiday season, which is responsible for the lion's share of retail, that number probably doubles. However, stocks trade only on weekdays and an average of $225 billion is traded daily, five times as much as GDP.
There is no business bigger than stocks. In fact, as seen above, the current situation is a replay of what occurred in the Roaring Twenties ending in 1929, the Tech Mania in 2000 and again as the housing mania peaked in 2007. This is the third stock mania
in 13 years.
Manias historically are once in a lifetime events. The inevitable collapse is typically accompanied by long memories and those that were burned stay away, possibly for the remainder of their lives. As an illustration, your Editor's father was a stock broker in 1929. After the crash, whatever stock he had left was tossed into a safe deposit box, where it resided until 1968. This is a true story, a portio of which was offered by your Editor to Nelson DeMille for his book Gold Coast (see page 46). The anecdote about the shares of Amerex Corp. is true. Amazingly, despite a 50% drubbing from 2000-2002, many people were eager to forget and another mania developed not only in housing but in stocks. But the second mania collapse has led to a complete metamorphosis of the stock market, an arena in which investment has become meaningless. Stocks trade only for the moment. Since the long term is of no consequence and holding periods have been cut to the quick, valuations are unnecessary. Stocks can trade at any level, it does not matter. Our stock market has been overwhelmed by high frequency trading (HFT). Many positions last no longer than the time it takes to read this sentence. Many bids and offers last no longer than the time it takes to punctuate the end of this sentence.
It's all absurd, bizarre, and
as a result, prices are a fantasy.
as they were in March 2000 and October 2007.... a stubborn streak of overvaluation.
The following was the lead article in our September 16, 2013 issue. Stubborn Streak. Theory: derivatives aid economic growth and are responsible for economic growth that would otherwise be difficult to achieve. Wrong. Adherents of the theory are plentiful in the field of the dismal science known as economics and they are nearly universal in their beliefs when proponents come from the banking and brokerage industries. However, theory is defined as speculation and conjecture based on assumptions drawn from limited knowledge. A theory that has been proved is no longer theory, it is fact. The theory that derivatives are responsible for economic growth have long ignored the obvious; they do not provide better economic growth. In fact, they hamper economic growth. We will hope to show you overwhelming evidence in todays rant, and make no mistake, this is a rant. Over the last few years, we have been acutely aware of what we see as irresponsible stances of the financial industry, those committed to protect investors (such as the SEC) and by the Federal Reserve Board to hide all the facts. The experience of recent years is now officially meaningless. In the first quarter of 2013, notional values of derivatives rose 3.8% from the end of last year to achieve a new all time record high of $231.6 trillion. If the pace continues for the remainder of the year, notional values will soar 16.1% for the year and add another $35.8 trillion to last years tally.
Above, our featured chart compares the countrys Gross Domestic Product (GDP) with total notional values of derivatives as reported by the Office of the Comptroller of the Currencys (OCC) category listed as insured U.S. commercial banks and savings associations. This is the number we typically report every few months in the newsletter, but it is important to note that even the $231.2 trillion shown in our rightmost bar pales in comparison to the tally for the category of the top 25 bank holding companies. How much? Glad you asked. That total is currently $296.8 trillion, an amount equal to 17.6 times our GDP and 15.6 times total stock market capitalization. As it turns out, derivative madness was only briefly interrupted by the financial crisis and has resumed an ugly trend destined for ignominy, a stubborn streak, if you will allow. The certain outcome of ignominy is foretold by the comparison you see on this page. Over time, more leverage, more credit and methods to accommodate leverage and credit have proliferated. We are now a society living not only on borrowed money but very likely on borrowed time as well. From the very beginning of the long inclined path on our chart, there was no proof that the increased use of derivatives would aid economic growth. The OCCs very first data point was for 1991, when notional values of derivatives were a mere $7.34 trillion, equal to 1.2 times GDP and 1.8 times total stock market capitalization. However, when we match notional values up against the 5-year growth rate in GDP, we see a trend exactly opposite to the common wisdom. The widespread acceptance of derivatives was entirely based on wrong assumptions. Below, the 5-year rate of change for GDP has been declining (with brief exceptions) for 21 years, since the data commenced and concomitant with the accelerating use of derivatives. While we have no doubt that derivatives and especially leverage have potential to temporarily boost economic growth, the attendant risks are gigantic. The three year rally in longer term economic growth into 2006 was punctuated with a massive one year increase of 29.6% in notional values of derivatives. The two year increase into 2007 was 63.2% and by 2008, the three year increase was 97.4%. The rest, as they say, is history. While the 5-year growth rate of GDP was enabled to climb to as high as 5.8%, the attendant risks kicked in and proved there can never be a free lunch.
From our standpoint, the nation is rapidly being painted into a corner from which escape is less likely with each new brushstroke by the Federal Reserve, Congress and the Administration. Its almost as if they are all clueless, led by the nose by a financial industry that cares solely about its own. The banks, exchanges and the brokerage industry have also completely transformed the capital raising functions of the equity market by reducing the long term to microseconds. As we have shown so many times previously, the proliferation of high frequency trading has afforded privileges in which the public cannot participate and which favors institutions to the detriment of the public. Derivatives have also favored institutions to the detriment of the public, by having the very substantial advantage of bailout possibilities. In fact, at this point in time, it is clear that the situation has become so onerous that there is no doubt that way too many institutions are indeed, too big to fail. If one goes down, the potential harm to the remainder of the system is too great and the risks too dire to entertain, thus another plunge into the chasm will be fixed the same way as before. The banks and brokers know this. The exchanges know this. There is no impetus to change or rectify or ameliorate the same kind of risks that placed the nation of the verge of the abyss in 2008. Thus, it will happen again. Thus, in a worst case scenario, the bailouts will happen again. Thus, the public will again be punished as the worst of double standards is allowed to endure. Below, notional values of derivatives for the top 25 commercial banks account for 93.2% of all derivatives. While all on the list benefit, clearly the top four are in a league by themselves. Ironically, as John Crudele commented in the September 7th NY Post, The real-life costs behind the JPM Cult of Jamie are substantial. When you add up all the costs to JPMorgan via fines, losses under Jamie Dimons tenure, it adds up to $28.2 billion over five years. But dont fret about Dimon or JP. While the company must indeed replenish the lost capital and for the nonce will have less capital to earn more capital or to lend for small businesses to help the economy, they can nevertheless take a tax deduction that will result in $7 billion less for the government. Even more hysterical is according to Crudele, the Federal Reserve is actually financing this $28 billion, since JPMorgan can borrow from the Feds window to pay out these fines. Crudele also comments, There has not been one clawback of anyones bonus, and from what was reported, last years bonuses were crazy-good. And it seems the word on the Street is, 2013 bonuses will be the same crazy-good. You can see the article at http://bit.ly/19uQOY3.
The purveyors of derivatives in mass quantity have more on their plate than you may care to know. See http://bloom.bg/12JCJVs. Bear in mind, thats $100 billion less to lend for small businesses to help the economy, but undoubtedly some of the amount will be countered by tax deductions. Will there be clawbacks? Sure. And if you believe that, we have a bridge to sell you. More can be found at http://bloom.bg/15hCBA7 and also at http://bloom.bg/14ceFYP. While not all of this activity is directly attributable to derivatives, there is a pattern way too strong for us to deny. Obviously, JPMorgan figures prominently in our analysis, since they alone account for 30.3% of all notional values in derivatives. Years of observation and analysis lead us to the conclusion that this new rapid expansion in notional values of derivatives has again led to a vast increase in systemic risk and has dramatically impeded economic growth. We will be very lucky if the consequences are better than last time.
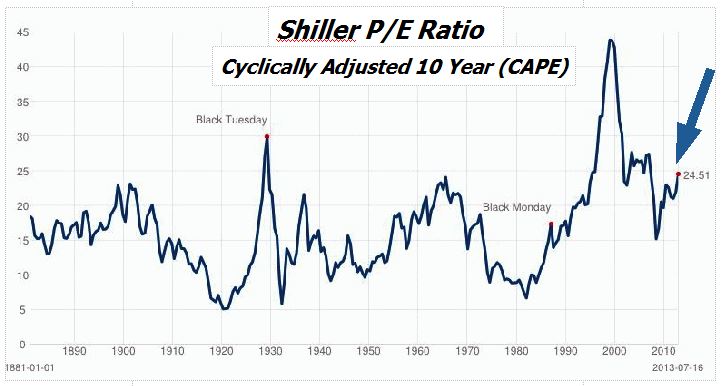
The following article is reprinted from our July 22, 2013 issue. Valuation Lessons In the final analysis, stock prices are supposed to be based on valuations. A company that has had an improving earnings stream and regular dividend increases theoretically should be valued higher than an unproven entity with only potential but of course, in reality, it doesnt work that way. Fear and greed rule the stock market and the implementation of greed fits the many ways participants may estimate potential. In the case of Amazon (AMZN), we have a company that began operations 18 years ago (was it really that long ago?) and seems destined to never trade at what should pass for a normal price/earnings ratio. Despite growing to $61 billion in revenue, AMZNs current price is equivalent to more than 96 times projected earnings for the fiscal year ending December 31, 2014. Stratospheric P/E multiples like this are indicative of greed on a grand scale. Of course, overvaluation is not limited to AMZN and we have also mentioned Netflix (NFLX) in the same category of egregiously overvalued companies. NFLX currently trades at a price equivalent to 86 times next years projected earnings. Why not cite current P/E multiples? Okay, we will. AMZNs is infinite since there are no earnings. NFLXs P/E is 649. Clearly, this does not make us feel any better about their valuations, but high P/E multiples do not automatically go hand-in-hand with immediate price declines, even when valuations are extreme for the entire stock market. However, when valuations are stretched for a lengthy period, say ten years, its usually a different story. High P/Es are likely to spell doom for even the best and most dynamic bull markets. At center, we see the current chart for a ten year average of P/E ratios made popular by Robert J. Shiller in his book, Irrational Exuberance (see www.irrationalexuberance.com/). The current 24.51 reading has been matched (or nearly so) only in the Roaring Twenties mania that ended spectacularly in 1929, the broad market secular peak for stocks in 1966, and the mania beginning in the late 1990s. Although the 10-year average has remained quite high for most of the period of the last 18 years, it has not changed the requirement that stocks must eventually trade at a fair value from a historical perspective. The two huge declines into the 2003 and 2009 bottoms are also plainly visible in our chart and are evidence of the inevitable necessity for fair valuations.
Dating back to 1880, the median Shiller P/E has been 15.88 and the mean 16.47. The mean represents close to a one-third decline in prices from today. Is it possible? Who would have thought that prices would have been halved into both the 2002 and 2009 bottoms? Yes, it is possible. Even a modest retracement to a Shiller P/E of 20 would cause a lot of consternation and this is precisely what we expect. [EDITOR'S NOTE: AS OF NOVEMBER 4, 2013, THE SHILLER P/E WAS 24.86]
A portion of our lead article
in the July 22, 2013 issue is reprinted below.
Dow 15,000 In May 2016 Despite the two manias and subsequent major stock collapses from 2000-2002 and 2008-2009, there is still a huge contingent of permabulls who believe that the long term always sees substantial gains. Nothing could be further from the truth. We have long been labeled as permabears, and again, nothing could be further from the truth. Lest we be misunderstood, we need to clarify our position. Its inconceivable that anyone could have been more bullish than your Editor in July 1982, a month before the super bull market began, or in December 1987, the day before stocks took off and never looked back, and again in January 1998, just before the invasion of Kuwait. But too much has transpired in the last 15 years and this is a completely transformed stock market. We believe the capital formation system is threatened by how the stock market has metamorphosed into a machine to profit exchanges, banks, brokerages and mechanical trading systems, all with extremely short term horizons. Nothing matters beyond a microsecond. It is no wonder that the public has not returned and we believe that as long as the arena favors the few over the many, the investing public will not return and we will all be the poorer. Wealth in terms of market capitalization is meaningless without the publics participation. There are also technical reasons for our bearish stance and you see perhaps the best perspective above, representing annualized returns for stocks over all 20-year rolling periods since 1917. The twin manias mentioned in the first sentence of our article have had a pronounced and outsized effect on the overall average return for stocks over the last century. For 78 years until 1995, stocks as measured by the Dow Industrials, returned 4% per annum, a benchmark that was once widely considered as the standard. Since the twin mania produced stunning gains, a newer generation has been influenced beyond all reason and believes there is a new standard of perhaps 7% or even 8% gains per year. However, reversion to the mean is a powerful and valid concept, especially in the current environment, where economic growth has slowed from previous decades and is expected to remain under pressure for years to come.
Thus, we are convinced that our line, currently sporting gains of 7.32% annualized over 20-years, will decline to the historical average of 5% at some point, and perhaps even the 4% standard seen for the 78 years until 1995. If the Dow simply moves sideways
at 15,000,
If we are headed to the 4%
historical standard of yore,
Of course, the reversion need
not last that long if
The 5% benchmark would be achieved as soon as June 2015. The 4% benchmark would be achieved in late January of 2016..... [The remainder of this article is available with a free trial of the Crosscurrents newsletter]
To see a free sample copy of the Crosscurrents newsletter, CLICK HERE
The typical four year bull cycle has already been exceeded by seven months. The cyclical bull market is on borrowed time. It is difficult, if not impossible to forecast a peak while the Fed feeds $85 billion per month into the financial markets, but at some point, not only will the break come, it may be as bad as the prior two bear markets that erased fully half of all stock market wealth. We consider the levels mentioned below to be extremely conservative, amost bullish in the face of what we see as phenomenal risk ahead for the nation. The stubborn streak of high
prices, overvaluations and derivative madness is likely to end as it did
twice before,
Projected Strong
Resistance
Worst Case Scenarios
First Correction Target - Dow 14,551 Reward to Risk Ratio: Extremely Poor THE CONTENTS OF THE ENTIRE WEBSITE ARE COPYRIGHT 2013 CROSSCURRENTS PUBLICATIONS, LLC I hope you have enjoyed your visit. Please return again and feel free to invite your friends to visit as well. Alan M. Newman, November 5, 2013 The entire Crosscurrents website has logged close to four million visits. All information on this website is prepared from data obtained from sources believed reliable, but not guaranteed by us, and is not considered to be all inclusive. Any stocks, sectors or indexes mentioned on this page are not to be construed as buy, sell, hold or short recommendations. This report is for informational and entertainment purposes only. Persons affiliated with Crosscurrents Publications, LLC may be long or short the securities or related options or other derivative securities mentioned in this report. Our perspectives are subject to change without notice. We assume no responsibility or liability for the information contained in this report. No investment or trading advice whatsoever is implied by our commentary, coverage or charts. |