|
- THE GREATEST STOCK MARKET MANIA OF ALL TIME - DATED NOVEMBER 15, 2005 A SPECIAL REPORT BY ALAN M. NEWMAN, EDITOR Alan M. Newman's Stock Market Crosscurrents This feature
is now published on a quarterly basis.
|
| This is our
51st report on the ongoing mania since we first published this website
on January 15, 1999. Well over three million visitors have read our
free features and well over one million visitors have visited this particular
page. Last night we viewed a world map of our readers and were delighted
to find we now have visitors from 76 countries!
This report is now mostly a compilation of articles that have previously appeared in the Crosscurrents newsletter. Our paid subscription stock market newsletter has only two rationales for its existence; powerful commentary and unique perspectives that cannot be found anywhere else. For a real eye opener, please check out the testimonials on our Kudos page.
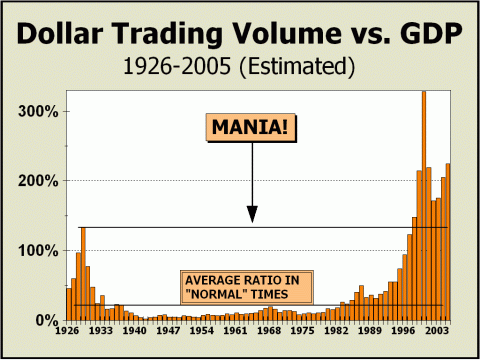
NOT QUITE A RECORD PACE, BUT.... In our last issue of the mania report, we complained that there was "....no way for us to get an easy handle on everything that is traded - such as Exchange Traded Funds." Although we can sum the numbers made available to us by the New York Stock Exchange and Nasdaq, there is no ready tally available for ETFs and trading in those entities has ballooned significantly in recent years. For clarification, activity on the NYSE is moving at a pace that will approach $14 trillion this year, more than all stocks generated only seven years ago, in 1998. While Nasdaq activity is far below that of the manic velocity achieved in the year 2000, it is once again ratcheting up quite rapidly. Activity is up 39% in the last three years and is now approaching the levels achieved in 1999, mere months before the manic peak. Meanwhile, there were a mere 29 ETFs trading in 1998 with only $15.6 billion in assets. There are now 175 ETFs with over $251 billion in assets. Trading activity in ETFs has exploded. The proxy for the S&P 500 known as SPY now generates annual activity of roughly $1.8 trillion, one of every sixteen dollars traded in the U.S. The Nasdaq 100 Trust, known as QQQQ, generates about $900 billion. The Russell 2000 ETF generates more than $350 billion. The Semiconductor Trust SMH generates almost $200 billion. And the Dow Diamonds generate another $180 billion. Between these five ETFs alone, $3.43 trillion in trading activity takes place, approximately 12.1% of all trading activity on U.S. exchanges. Total Dollar Trading Volume is at levels that exceed any year except the blowoff peak established in 2000. DTV for the NYSE is now 19% ahead of last year's pace and is 25% higher than the clip maintained in 2000. While Nasdaq's DTV is now only ahead 13% of last year's pace, it is also 41% ahead of 2003. We must admit Nasdaq's DTV still lags tremendously behind the pace of 2000, but we must remind readers that Nasdaq stock prices remain far, far lower (56%) than they were at the manic peak. Total DTV is estimated at $28.27 trillion versus GDP (through June) of $12.59 trillion and total market capitalization of $15.09 trillion. This places DTV at 225% of GDP and at 187% of market cap. To repeat our conclusion from the last report, these measures are the second and third highest ever recorded respectively and clearly illustrate the the mania for stocks is still on overdrive and in fact, never really ended at all.
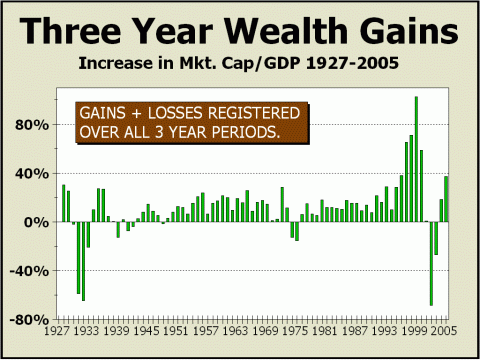
THE MEMORY OF THE BUSTED BUBBLE HAS FADED Three year wealth gains measured as the increase in total market capitalization vs. GDP are now over 37%, the same as 1996. The Dow ended '96 at 6448, was just 3834 two years earlier, and soared 55% in 1995 alone. It was this period that fortified investor confidence, enabling the mania that took prices into the stratosphere in late 1999 and early 2000. Note the bar for 1996 was a record breaker, even higher than in the Roaring Twenties. And now, three year wealth gains have come roaring back and in our view, have once again enabled investor confidence. The lead article in the just published November 14th issue of Crosscurrents focuses on this phenomenon. Investors and professionals
are arguably as optimistic
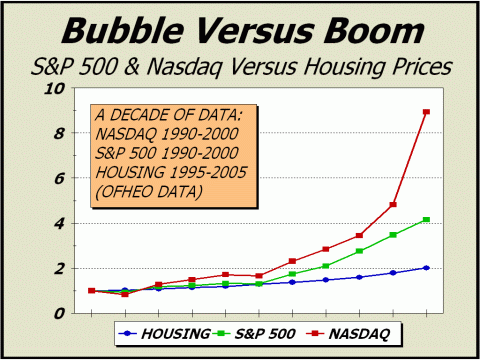
For well over a year, we have reprinted several articles originally published in Crosscurrents for our mania report. Presenting all new material on a public site only punishes subscribers for their loyalty. Meanwhile, looking back at our previous Mania reports, we are pleased that our desire to serve the public has been fulfilled with timely and powerful commentary and unique perspectives, despite presentation weeks or months after the original publication. WHICH IS THE BUBBLE? HOUSING OR STOCKS? Is housing in a bubble? Seems every day we see another news story dedicated to the proposition that not only is housing in a bubble, but that the bubble will bust imminently. Strangely, not a word is uttered about the still extreme valuations of stocks. Perhaps this comparison offered in the August 15th issue of Crosscurrents will illustrate how bizarre this situation is. Media coverage of the housing "bubble" has continued apace recently. Seems not a day goes by without several stories of excess. However, stories such as Stephanie Jucar's piece in the Lodi-News Sentinel provide another slant on the supposition of a bubble. The headline reads "Homeowners afraid housing bubble will burst," and the article is accompanied by significant reportage, such as "Rachel Campbell can't decide what she wants to do with her Galt home she bought two years ago for $205,000 -- keep it or sell it." Therein lies the rub. The vast majority of the public have been reading about the housing bubble for months and wonder what they should do. But given that a residence is a necessity and not just an option, how many folks can we expect to do anything but elect to stay where they are? Can folks even time the market and get out while they can? Consider that brokerage commissions for the sale of a home are enormous, as much as 6%. Then, the homeowner must either downsize considerably to save money or rent, thereby losing a huge tax write off. For the vast majority of Americans, selling is just not a reasonable option. Equating the housing situation to the bubble that existed (and still does) in stocks, makes no sense at all. A boom is one thing. A bubble is quite another, as our next chart clearly illustrates, using the last ten years into the mania peak, the last decade of gains for housing, and indexing all to a starting value of 1. Allegiance to stocks runs a very poor second in relation to the allegiance to one's abode. If housing prices begin to correct to the extent that homeowners are compelled to raise cash, there will certainly be massive selling of equities from both personal and retirement accounts, rather than a panic to sell homes. We have no doubt that prices in certain areas are totally bonkers, particularly in California. But this does not make for a nationwide bubble. WSJ's Neil Barsky recently asked, "What Housing Bubble?," pointing out that "Home prices on average have risen at a 6% annual pace since 1999, and 13% over the past year." By comparison, the S&P 500, fully 80% of the entire U.S. stock market, rose at an astounding 25.4% clip for the five year period leading up to the March 2000 peak. The latter was a veritable bubble. Comparing housing to stocks just doesn't fly.
But how about stocks? How does this comparison from our August 15th issue strike you? Urbandictionary.com defines "Booyah!" as "an exclamatory statement, often said when someone is extremely overjoyed..." Nowadays, the term is probably heard most often on Jim Cramer's Mad Money televised on CNBC, since just about every caller begins their conversation in just that fashion. How could this be anything but a continuing stock market mania....? Booyah....?! Brett Ahrends covered his impressions of Mad Money in the Boston Herald a few weeks back and of course, we're inclined to agree that the show is "....further proof that the equity bubble still hasn't fully deflated." Not only hasn't the bubble deflated, it has taken on new and grossly obscene angles, such as Cramer's show. In a commercial spot, CNBC claimed to be "releasing" Cramer to the public for it's "Mad Money Main Event," purposely comparing the show to professional wrestling's wild and tumultuous arena. The comparison is bizarre and equally so, is the show itself. Just what we'd expect to hear in a veritable stock market mania.
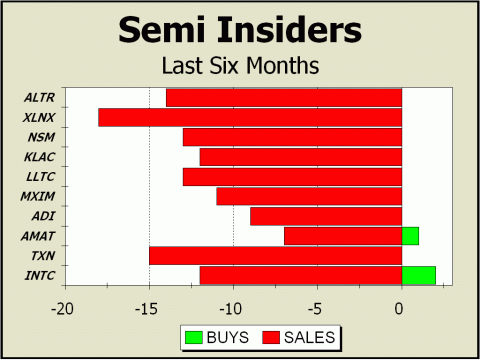
WHO'S NOT BULLISH ON SEMIS: INSIDERS In the September 26th issue, we covered our views on Semiconductor stocks, as overvalued as any sector in our view. The SMH Semiconductor Trust opened for trading at $36.57 when the article was published and traded as low as $32.57 on October 28th, one month later. Although the article and charts are a bit dated now, our points about valuations are still quite pertinent. We last covered insider activity in the semiconductor sector on June 6th, close to four months ago. Although activity at that time clearly indicated that sellers were frantically shedding shares, their demeanor is far more frenzied now. The ten stocks we have chosen to monitor represent more than 85% of the SMH "HOLDRS" Semiconductor Trust, an Exchange Traded Fund (annual high $38.32-current price $36.20). As we have pointed out many times previously, a substantial portion of the demand for these issues has been the ETF itself. In order for ETF shares to be created, shares of the underlying issues are deposited with the trust. SMH now boasts a capitalization of 79.3 million shares, of which roughly 24.8 million trade each day. Total assets of the trust are now over $2.4 billion. It would appear that insiders are taking advantage of the ample demand by dumping every share they can. In our last report, we had counted 103 sales versus only 4 buys, a sell/buy ratio of 25.8 to 1. We now see 124 sales versus only 3 sales, a sell/buy ratio of 41.3 to 1 (covering the prior six months to 9/12/04). However, the worst aspect of our comparison deals with the number of shares transacted. Our tally presented in the June 6th issue was 4.3 million shares sold versus only 8000 shares purchased, a sell/buy ratio of 542 to 1. A few days ago, we tallied 6.7 million shares sold versus only 7250 shares purchased, a sell/buy ratio of 929 to 1. Our semi insider report in the February 28th issue was followed by a swift decline of over 13% in SMH but our June 6th report was followed by a 10% rise in price. What is at work here? Clearly, "investment" cannot be a major impetus for a sector ETF that trades nearly one-third of its capitalization every day (roughly 79 times over each year). We believe speculation on a massive scale accounts for the lion's share of the action. Considering that the ten issues pictured trade at more than six times their sales, it can hardly be “investment.” Only five years ago, Sun Microsystems Scott McNealey told BusinessWeek, "....two years ago we were selling at 10 times revenues when we were at $64. At 10 times revenues, to give you a 10-year payback, I have to pay you 100% of revenues for 10 straight years in dividends. That assumes I can get that by my shareholders. That assumes I have zero cost of goods sold, which is very hard for a computer company. That assumes zero expenses, which is really hard with 39,000 employees. That assumes I pay no taxes, which is very hard. And that assumes you pay no taxes on your dividends, which is kind of illegal. And that assumes with zero R&D for the next 10 years, I can maintain the current revenue run rate. Now, having done that, would any of you like to buy my stock at $64? Do you realize how ridiculous those basic assumptions are? You don't need any transparency. You don't need any footnotes. What were you thinking?" SUNW now trades at 1.2 sales, down 91% from McNealy's very pertinent thoughts. Although SUNW is not a semiconductor stock, McNealy's points remain valid for any issue, tech, internet, semi, any issue at all. What are buyers of the semis thinking?!
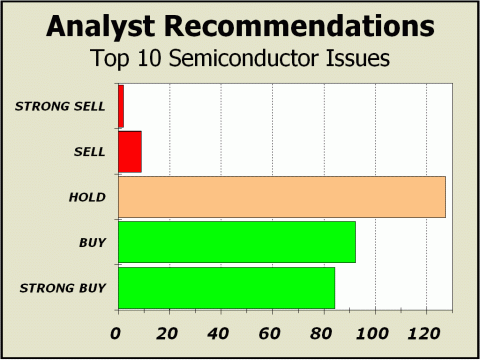
Interestingly, despite years of overvaluation and one of the most crushing bear markets ever, Wall St. analysts still wax enthusiastic over semi companies. Through thick or thin, no matter the environment for stocks, buy recommendations over the last few years have always been in the neighborhood of 55% to 60% and sell recommendations roughly 4%. True to form, our tally now places buy recommendations at 61.8% of the total and sells only 3.9%. But the SMH is still down 54% over the last five years! How can the group ALWAYS sport ratings that are so similar from time to time? Analysts’ “buy” ratings would seem to be completely meaningless.
Not Your Father’s Stock
Market Anymore
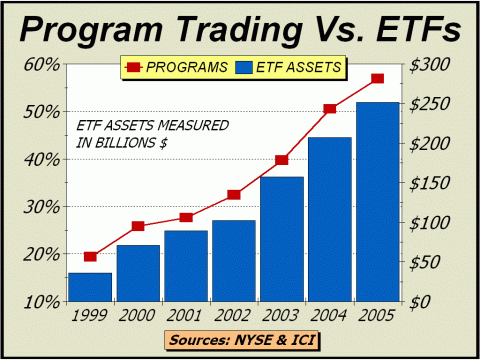
Crosscurrents has been on the warpath versus Program Trading for a long, long time, actually since our newsletter was first published in May 1990. Over the past year and change, we have probably featured charts showing how programs were overtaking all other types of traditional investment at least two dozen times. Unfortunately, the trend towards automated trading continues to build momentum. For the week ended September 16th, trading totaled 9.33 billion shares on the New York Stock Exchange. Programs accounted for 6.61 billion, or 70.9% of the total, the third largest percentage of program trading ever recorded. And if that was not enough, it was reported that brokerage firms executed an additional 4.2 billion shares of program trading away from the NYSE. Are we the only observers who are uncomfortable with the rapid expansion of this kind of trading? By definition, program trading involves the "simultaneous purchase or sale of at least 15 different stocks with a total value of $1 million or more." It is clear that the execution of a trade for a single stock at any point in time - whatever the size of the trade - may be reasonably expected to reflect company fundamentals and an educated estimate of fair valuations. But the simultaneous purchase or sale of at least 15 different stocks cannot function under the same assumptions! Our colleague, Jim Bianco (www.biancoresearch.com), has repeatedly linked the growth of program trading with the growth of Exchange Traded Funds (ETFs). Both are growing at phenomenal rates. NYSE program volume has expanded at a 32% rate over the last five years. ETF assets have expanded at a 29% rate over the last five years. Our featured chart amply illustrates the inclined path each takes. But finally, recognition is appearing that the status quo may not be beneficial. Barron's Jack Willoughby recently quoted Bianco, "The majority of trading is no longer investors buying a stock based on a company's fundamentals, it's program traders buying groups of stocks and making macro plays." From very modest beginnings in 1993, ETFs are now a huge business and have attracted more than one-quarter of a trillion dollars in assets. Although this represents less than 2% of total market capitalization, bear in mind ETFs have not been around all that long. Growth did not begin to accelerate rapidly until 2000, when assets rocketed from $36 billion the prior year to $71 billion. By contrast, mutual fund capitalization was as low as 6.4% less than 14 years ago, but has now grown to 22.5% of the whole stock asset pie. Of course, much of the growth in mutual funds has come from indexing, yet another methodology in which fundamentals are not considered and a strategy that also drives a large part of programs. Although the S&P 500 Index is actively "managed" by a selection committee, the criteria used are faulted, inefficient and arbitrary, such as a move last year to remove all remaining foreign issues from the index. See Jon D. Markman's excellent article (from a few years back) for a perfect explanation of why the selection process fails. Thus, we find ourselves ensconced in an environment where the majority of trading and investment have nothing at all to do with individual company prospects, just sophisticated trading strategies that hopefully, will take advantage of extremely small discrepancies in perceived pricing anomalies. If this is the path to riches, the road must indeed be paved with pitfalls. We repeat for the umpteenth time, if the majority of transactions now effected on our major exchanges no longer reflect the fundamentals or prospects of publicly traded corporations, there cannot be a reasonable expectation that stocks are reasonably valued. Thus, we can only assume that stocks are not fairly priced. If this is the case, our $15 trillion market is as risky as it has ever been.
YEAR
"5" FLOP?
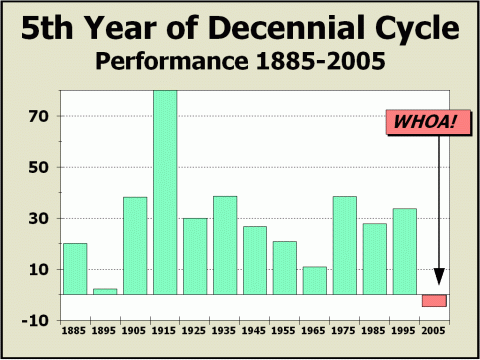
Back in the November 1, 2004 issue, we pointed to the Decennial Cycle, in which the years ending in “5” have been nothing short of sensational. In the last dozen years ending in “5,” gains have averaged a phenomenal 30.7%, with only 1895 finishing with less than a 10% gain. Who wants to bet against that kind of record? But we discussed the year 5s in the Decennial Cycle and claimed, “there is more to this story and as tempting as the [Cycle] appears, it is clearly not a guarantee…” Seems we nailed this one….so far.
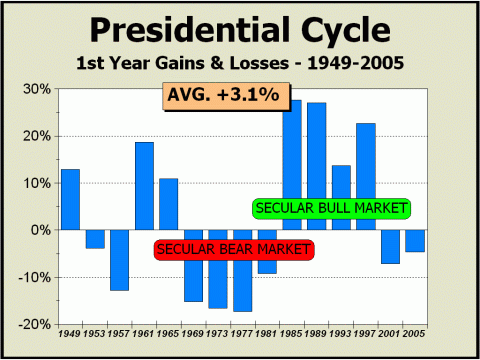
Our table illustrates gains for the last ten years ending in “5” up to October 17th, the same date as today, and subsequently, the gains for the entire year. The present year appears to be way out of whack and if the Dow does not catch fire quickly, the Year “5” of the Decennial Cycle will be a huge flop. In our December 6, 2004 issue, we showed why the Year “5” could flop and you see the reason repeated below. The 1st year of the Presidential Cycle also seems to favor the current year, averaging a 3.1% gain, so at first glance it would appear that the coincidence of both cycles favor stocks. But again, there is more to the story than meets the eye. Looking more deeply into the Presidential Cycle, we can see that losses were the order in the prior secular bear market while gains were the order in the secular bull market that followed. If we are correct in our assumption that a secular bear market is still in progress, then the Presidential Cycle favors the downside and Year “5” string of resounding gains could end with a whimper.
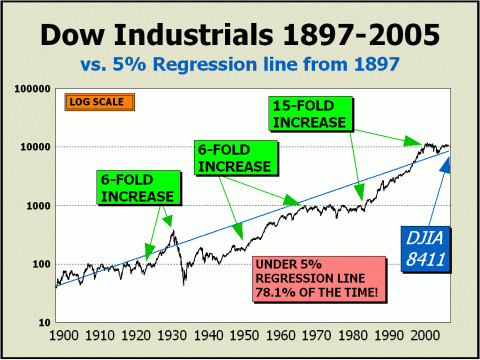
WHERE DO WE GO FROM HERE? Where do we go from here? Over the longer term, most likely, down. Despite the seasonal tendencies, stocks appear to be fighting against a history that does not accommodate higher prices. We have featured our 5% regression chart many times before, simply illustrating what 5% growth achieves for the Dow Industrials over the course of history. In fact, the Dow has traded under the regression line 78% of the time. In fact, the regression line accurately predicted the stock market low achieved in mid-October 2002 when the Dow briefly traded intraday below the line! The regression line now stands at 8411 and is rising at close to 8 points per week. The current level of the Dow - at roughly 10,500 - will not be matched by the regression line for another 4-1/2 years, another reason why we believe the secular bear market has much further to run.
Still on Overdrive.... In our view, stocks are still on overdrive. The apparent end of the stock market mania when Nasdaq collapsed in 2000 was just a time out. Although prices remain far below their peak, confidence does not. [Ed Note: On February 28, 2000, we predicted a Nasdaq crash and even gave a 3000 target, achievable by mid-April, which would have been a 35% decline in only six weeks. Nasdaq topped at over 5000 just two weeks later, and traded at the 3300 level by mid-April.] Instead, the cash-to-assets
ratio of mutual funds
Total margin debt is higher
than it was at the end of December 1999,
Margin debt at Nasdaq firms is at an all-time record high. [For more info, see the November 15, 2005 issue of Crosscurrents]
We have abandoned our low targets for 2005. Not only is there not enough time for those targets to be achieved, but it is patently clear that there is still sufficient support from mutual fund inflows to prevent a debacle. That said, mutual fund inflows have diminished and do not appear to be sufficient to drive prices to anything more than nominal new annual highs. In our last issue, we stated that, "....prices are capable of rallying as much as 17% off a September/October '05 bottom into the spring or summer of 2006, to be followed by the worst decline since 2000, one that may very well mark the secular bear market price low." The 17% was assumed from a much lower low than actually achieved, thus our expectation is now for a much more muted rally phase that could end as early as February 2006, before a severe downtrend takes hold later next year. Although we are not quite as confident as before of our secular bear market low target of Dow 6400 by the fall of 2006, we still believe this is the highest odds scenario. Clearly, the fundamentals of higher interest rates, higher energy prices, higher inflation and lower consumer confidence are capable of catalyzing a dramatic move to the downside. However, as Intel's recent announcement of a $25 billion buyback clearly illustrates, many larger companiers are well heeled enough to maintain support levels. We have now established a secondary secular bear market low target, corresponding with the regression line in the chart above. Dow 8500 - SPX 980 - Nasdaq 1750, approximately 20% lower than today. Caveat: these levels could be achieved several times in the next few years and it might be a decade before a new secular bull market is capable of taking the major averages above the peak achieved in 2000.
High
Targets for 2005 - even odds that the tops are in:
Low
Targets for 2005 - TARGETS
ABANDONED
Long
Term Targets for ultimate secular bear market low - most likely to occur
in autumn 2006
THE CONTENTS OF THE ENTIRE WEBSITE ARE COPYRIGHT 2006 CROSSCURRENTS PUBLICATIONS, LLC I hope you have enjoyed your visit and please return again. If you know anyone who might be interested in seeing what we have to offer, we'd be happy to have them visit as well! Alan M. Newman, November 15, 2005
This feature was established on January 15, 1999.
All information on this website is prepared from data obtained from sources believed reliable, but not guaranteed by us, and is not considered to be all inclusive. Any stocks, sectors or indexes mentioned on this page are not to be construed as buy, sell, hold or short recommendations. This report is for informational and entertainment purposes only. Persons affiliated with Crosscurrents Publications, LLC, may be long or short the securities or related options or other derivative securities mentioned in this report. Our perspectives are subject to change without notice. We assume no responsibility or liability for the information contained in this report. No investment or trading advice whatsoever is implied by our commentary, coverage or charts. |
