|
- ADDITIONAL PROOF OF THE GREATEST STOCK MARKET MANIA OF ALL TIME - DATED MAY 5, 2004 A SPECIAL REPORT BY ALAN M. NEWMAN, EDITOR LONGBOAT GLOBAL ADVISORS CROSSCURRENTS |
| As the market
topped earlier this year, we began to see the phrase "bubble echo" emanate
from a few erudite and savvy analysts. Right on the mark! The
perfect bear market has an initial decline followed by a significant rally
to suck in those who either didn't buy the first time around or who then
feel compelled to "average down" or who are just plain ignorant of valuations
- still rich despite lower prices. Via the pictures we examine, week
in and week out, we see the "echo" represented everywhere from transactional
velocity to sentiments, both short and long term. Investors have
learned nothing from the first round of what we believe should go down
as the worst secular bear market since the Great Depression. As amazing
as it might seem, despite the steepest decline in prices since 1973-1974,
stock mutual funds are still finding sponsors in significant fashion.
In the four years since prices peaked in March 2000, a NET of more than
$433 billion has flowed into funds (assuming $20 billion net inflows for
April)! Worse yet, as we discussed in the most recent issue of our
Crosscurrents newsletter, The Arizona Republic recently carried an article
by Russ Wiles citing investment regulator concerns that investors are using
home-equity loans or refinancing cash to invest, "imperiling their homes
in the process." Given that some of these players may be also utilizing
the temptation of margin loans as well, we'd say "imperiling" is a very
apt description of the risks at hand. Even a very modest portion
of refinancing money in stocks or perhaps even placed on margin, would
be solid evidence of a "double bubble." Has a "double bubble" been
underway? Our pictures certainly say it has.
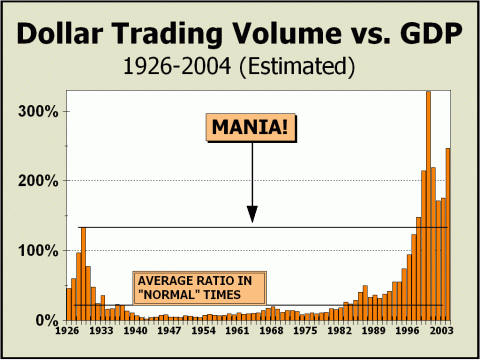
- VELOCITY - As always, we begin our report with an update on Dollar Trading Volume, a measurement we believe is the best method of discerning whether there is or is not a stock market mania in place. Accurate trading records do not go back to prior centuries, so it is impossible to gauge the full extent of manias such as the South Sea Bubble and Tulipmania. However, the turn into the 20th century witnessed great technological advances and enabled an excellent record of the mania known as the "Roaring Twenties." An entire nation was besieged with the notion that anyone could strike it rich in stocks. All you needed was 10% down and a double in the price of the shares would multiply your stake ten-fold. As prices rose, participation rose, and stories from those wild times even had elevator operators and shoeshine boys not only making a fortune, but giving tips and advice. Of course, the fantasy was only temporary and the extension of leverage became a vise that squeezed participants into bankruptcy. By the end of 1929, total Dollar Trading Volume had reached 133% of Gross Domestic Product. Since prices had already declined by close to 36% by the end of the year, it is certainly possible to make the case that the peak in DTV was higher than that shown. We are not prepared to do all the labor required to make the actual computations, but given that volume actually expanded greatly in accompaniment with the crash and was lower earlier in the year, we believe we can fairly estimate that DTV achieved a peak of at least 150% and possibly was closer to 175% of GDP. However, we can make essentially the same assumptions for the year 2000 and estimate that DTV actually peaked at higher than 350% of GDP. No matter how you slice it, 2000 was as virulent a mania as any concocted by human beings since the dawn of time. Incredibly, at last count, we are once again reaching for the high point achieved in 2000!
However, tallying the numbers is no longer as easy as in the past and all we can present are estimates. The American Stock Exchange provides no records of DTV and via the constituents known as Exchange Traded Funds, the Amex has now become a major force in the velocity of trading. The top five ETFs, comprised of the QQQs (Nasdaq 100), SPY (S&P 500), DIA (Dow Diamonds), EWJ (Nikkei) and IWM (Russell) will likely be responsible for at least $2.6 trillion in DTV this year, close to 10% of all dollar trading volume in the U.S. stock market! Overall, the ETF category will be responsible for well over $3 trillion in 2004. Needless to say, our estimates of DTV are once again rising with alarming rapidity towards levels seen only once before, and are already on track to exceed 1999 and 2001 by a very wide margin. Also important; the business of stocks has graduated into the business of stocks and indexes. Anything that can be traded, is traded or will be traded. Options and futures on all kinds of derivatives now exist, including the VIX volatility index. Now that we have reached the stage where there are derivatives of intangibles in addition to asset-based instruments, we can only surmise we are nearing the terminus of the madness.
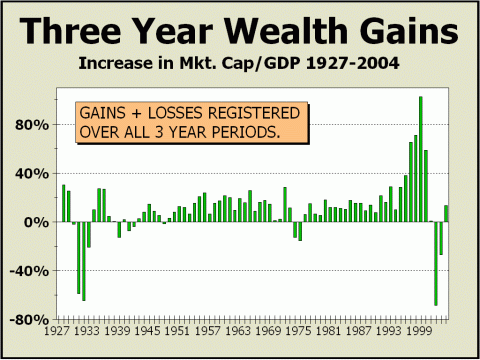
- WEALTH - Meanwhile, the Federal Reserve has done its part in keeping the mania alive and via their robust sponsorship of financial assets, have seemingly turned the corner for the wealth effect. Given how three-year wealth performed in the most recent stock price collapse compared with the fallout from the great crash of 1929, there was a clear and present danger of a repeat performance. In a January 3, 2004 speech Fed Chairman Alan Greenspan stated “There appears to be enough evidence, at least tentatively, to conclude that our strategy of addressing the bubble's consequences rather than the bubble itself has been successful.” Forget the fact that the Chairman actually recognized the bubble brewing more than eight years earlier and did absolutely nothing to rein in the exposure of investors. By turning down the possibility of raising margin requirements, Greenspan avoided the one sure way he admitted he could stop the bubble in its tracks and instead elected to do nothing. As a result, at one point close to $9 trillion in wealth had evaporated and all the stops had to be pulled out to avoid an utter disaster. Unfortunately, while the Fed's plans have thus far worked, there appears to be no guarantee they will continue to provide a backdrop for a healthy recovery. In fact, Greenspan recently proclaimed, “My own sense is that we don't have to worry too much about the emergence of real bubbles again for a while because I think it takes a number of years for the trauma of the collapse to wear off.” Our charts are a clear disputation of the Chairman's incoherent ramblings. Without any doubt, the mania endures.
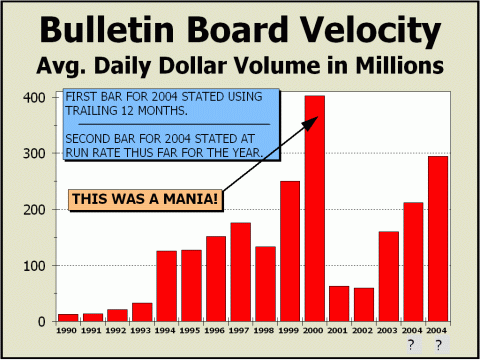
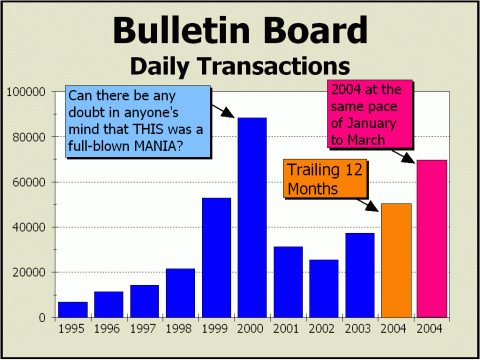
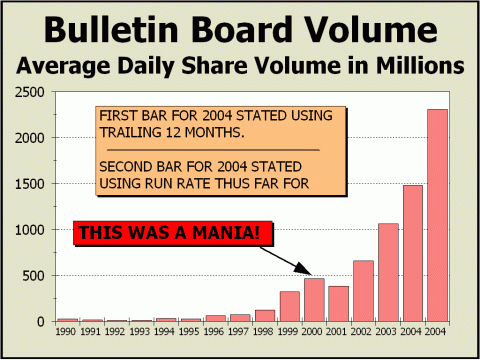
- DOUBLE BUBBLE - Reprinted from the February 23rd issue of Crossurrents (charts updated): We usually have to wait until much later in the year before finding a chart worthy of being categorized as our Chart of the Year, but we may just have the perfect candidate after only 54 days. The OTC Bulletin Board has been a favored subject of ours recently and if you were looking for additional and solid proof that the American public is still very much ensconced in a full blown mania, look no further. The Bulletin Board's own website at www.otcbb.com measures action via share volume, dollar volume and the number of transactions. Each was a moonshot in 2000 as befits a mass hysteria concerning companies of which almost nothing is known and of which almost no value can be found in most cases.
It is somewhat sobering to realize that total transactions rose 13-fold from the initial year the bubble commenced in 1995 to the year in which the first stage ended in 2000. But even that revelation is modestly dwarfed by share volume statistics that rose more than 19-fold in the same span of time! Total share volume for the NYSE and Nasdaq amounted to 746 million shares per day in 1995. Can one comprehend the massive amounts of money that would have been required to drive the number higher by a factor of 19?! In case you're interested, it's over 14 billion shares per day. After taking a proper time out for the obligatory collapse from the bubble peak, the Bulletin Board is apparently now back to the races. Dollar volume still lags as prices were decimated in the Nasdaq crash and are still considerably below their peak levels. However, transactions are definitely on the rise and in January measured 4.4 times as high as September 2002, when you couldn't give these suckers away. If the early '04 pace continues, transactions for 2004 will come within 16% of the 2000 level.
But it is in share volume that we see the mania working to its fullest extent. It's as if the Holy Grail lay in the hallowed reaches of the Bulletin Board and all were furiously searching for the Chalice of Instant Gratification. It was bad enough that total share volume set a new record in 2002, then again in 2003! The trailing 12 months to January 2004 are now 2.7 times as much as were traded in 2000 and are already 17% higher than the total for 2003. Those of you who are mathematically inclined will immediately realize that January's volume total must have been enormous. It was, coming in at a rather spectacular 2.87 billion shares per day. In fact, at January's rate, share volume for this year would be 2.6 times last year's record clip and an absolutely amazing 5.9 times the rate of 2000. Saddest of all is that there appears to be little or no recognition that the mania is still very much in place. Who's going to admit it? The major brokerage houses? Mutual funds? The SEC? The Federal Reserve? Total stock market capitalization probably peaked somewhere around $18.65 trillion and cratered to roughly as low as $9.18 Trillion at the October 2002 low. Meanwhile, at the peak, spending by governments, corporations and consumers were all predicated on the $18 trillion in stock market wealth and continued growth from that level! Close to $9 trillion in lost wealth says it all. The Greenspan and Bernanke Fed are desperate to get the money back into stock accounts. Given the amount of debt now in the system assumed by governments, corporations and consumers, we're absolutely screwed if they don't. Then again, we may be screwed if they do, since a reflation of the bubble would play out valuations somewhere way beyond absurd, wouldn't they? An interesting predicament, no? But the Fed doesn't care since they have consistently argued that they can "address the consequences" after the bubble bursts again. Given that there's leeway of only one percent on the downside for interest rates, we have no clue how the Fed can deal with another implosion. We're certain they have no clue either and are just desperate to keep the game alive, which of course, only lights the fires of speculation even brighter than they were yesterday. Joseph Heller’s Yossarian would have loved this Catch-22.
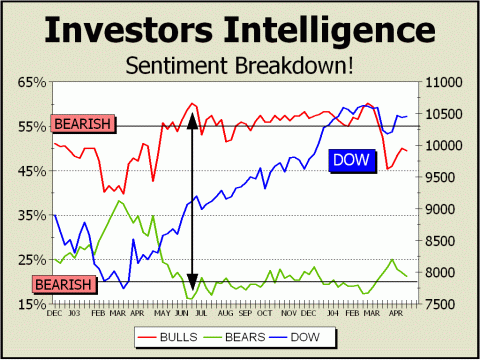
- PREPONDERANCE OF BULLISH EMOTIONS - Reprinted from the March 8th issue of Crosscurrents (charts updated): Time and time again, we have gone to charts of sentiment to show you how worked up folks are about the U.S. stock market. Any lingering doubt about the veracity of the mania should have been shot down with the continued bullish positions shown by Wall Street Strategists, Investor's Intelligence, the American Association of Individual Investors, the Rydex numbers or Put/Call indicators, but none of these have interfered with the propensity for participants to pile on. But surely, we are approaching some kind of barrier that offers evidence that practically no one may be left to buy. Seen below, even one of the most enormous gaps between bulls and bears in years did nothing to catalyze even the shallowest of price corrections. Although the gap between bulls and bears has narrowed a bit, it is still wide enough to consider that bears have thrown in the towel and pretty much disappeared from the scene. RED LINE ABOVE BEARISH LABEL EQUATES TO BEARISH. GREEN LINE BELOW BEARISH LABEL EQUATES TO BEARISH.
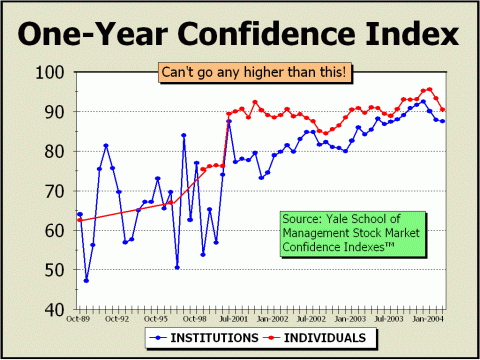
Could it be that practically no one is left to buy? For such evidence, we went to view the work of Robert Shiller and his colleagues via the Yale School of Management Stock Market Confidence Indexes™. We were stunned to find the One-Year Confidence Index recently at its highest level ever, 94.7% for institutions and 95.2% for individuals! 95%! Although the data and graph do not show any particular contrarian relevance to market highs or lows, what is of great interest is that beyond the short term zigs and zags, there has been a pronounced inclined trend for many years that prices will be higher one year out. Clearly, this has something to do with the continued optimism displayed by professionals and the media and most importantly, the Federal Reserve's actions to ensure the best possible scenario for stocks with interest rates providing bonds with little competition for investors. Bear in mind that there are no readings listed for individuals between October 1989 and October 1996, nor between October 1996 and April 1999. Both poll samples were initially conducted every six months and then more often and are now conducted on a monthly basis. Only one institutional response ever came in below 50% and that was only three months before a bull market peak. There were a couple of other instances where institutional timing appears to have been fairly proficient but every reading since April 2000 has shown a hefty level of confidence which continued to grow even as the S&P 500 lost half its value! Individuals never lost their faith. Never. The lowest reading on the chart was the first sample taken in October 1989 at 62.5%. Since the bear market bottom of October 2002, individuals' confidence has averaged 91.1%. But if you want the real shocker, it is that during the worst part of the bear market from April 2000 to October 2002, individuals' confidence still averaged nearly the same at 87.4%! Nothing swayed the faithful from their appointed beliefs, as the repetition of the long term "buy-and-hold" mantra emanated in a continuous sound loop from those financial institutions that sell stocks as "products." Theoretically, we would guess that investor confidence could more closely approach the ultimate barrier and that prices could indeed, wend their way in the same direction, but we'd be disinclined to believe either trend can be maintained for long. After all, 100% confidence is as high as it can get and we're sure there's at least one seller left in the universe.
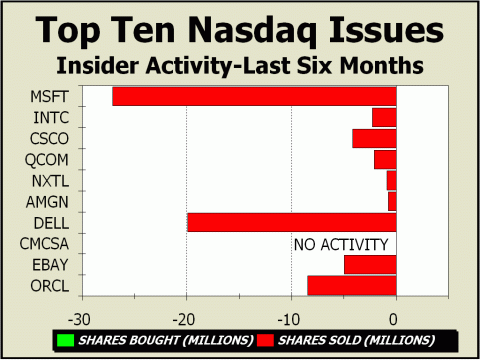
- THE "INSIDE" TRUTH - The April 5th issue of the Crosscurrents newsletter was entitled, "Nasdaq Insiders Fleeing For Their Lives," an apt description of the picture you see below. The top ten issues of the QQQ Nasdaq Trust represent more than 41% of an entity worth more than $22 billion on its own. To say that the QQQs are popular is like saying Alex Rodriguez makes a decent wage. Approximately 100 million shares are traded every day, which means the entire Trust capitalization turns over about every six sessions. Despite the burst bubble of a few years ago, the Nasdaq website is STILL touting the QQQs as an “investment,” just as they did in the heyday of March 2000. Nasdaq claims "The purchase of a single share.....[is] all it takes to invest in the largest and most actively traded companies on The NASDAQ Stock Market." The tout furthermore reveals that, "….because NASDAQ-100 Index Tracking Stock trades like stock, you can buy them on margin, sell short or hold your shares for the long term." Imagine that. The long term? Judging from the activity generated every day, we can't easily imagine what the short term measures for the Qs. Think of it - the entire capitalization is traded 42 times over the course of a year! But surely, if the Trust is an attractive investment, then the insiders at the top companies should feel the same way, correct? In fact, Insiders are deserting the top ten QQQ companies at a pace we have never witnessed before. Only Comcast has escaped the wrath of insiders but also knows no confidants either. Zero activity. Elsewhere, it's as if the anti-matter container of Dan Brown's Angels & Demons was sitting in the corporate headquarters of each and every other constituent of the top ten. A mere 5 buyers competed against a veritable army of 254 sellers, a ratio of 51 to 1. Although we have seen the same ratio before, it is the concentration of activity you see here that really caught our eye this time around. The buyers invested in a grand total of 8000 shares while slicing and dicing through 70.6 million shares on the sell side. In case you haven't yet noticed, the amount of shares sold is a staggering 8830 times the number purchased and equates to a net of 86,255 shares sold by just these insiders every trading hour of every trading day over the last six months. The prior record from our earlier ramblings was a mere 1857 shares sold for every share purchased back in July 2003. Just to show how grossly divergent the gap between buyers and sellers is, if we made the bar for Amgen's 4000 shares purchased one-eighth of an inch, the bar for Oracle's shares sold would extend 22 feet in the other direction! Ironically, we note that earnings have actually improved for the top ten and the average P/E, which has come in consistently higher over the last few years, is now down to "only" 46 (we're counting Comcast's loss as a 100 P/E, when it is in reality, infinite). Of course, as we have discussed in previous issues of Crosscurrents, there is essentially zero reason for corporate insiders to reward shareholders with dividends, so they do not, and the average yield for the group is a pathetic and selfish 0.2%. Remember, if dividends are paid out, share price drops and stock options are not as valuable. And of course, this is another reason why every ounce of productivity is relentlessly pursued, why every job that can be outsourced, will be outsourced, and why every accounting gimmickry ever devised and that has yet to be devised, will continue to be devised - to keep the shares as richly priced as possible for insiders to unceremoniously dump the very first opportunity they can. The new FASB accounting rules will change this to a marked degree in 2005 but will also pare earnings sharply for a great number of tech companies. Here, perfectly illustrated, is what insiders think of the value of their shares.
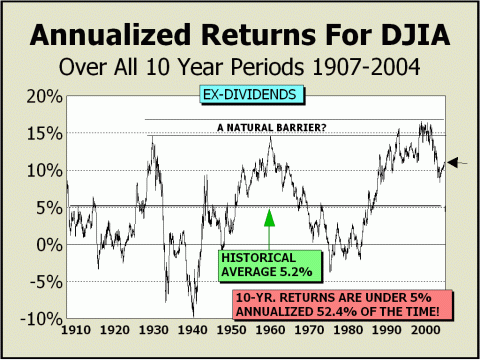
- NO GAINS FOR ANOTHER 3 TO 5 YEARS?! - When did the mania actually begin? Mickey Levy, who was then President of Nation's Bank, claimed he saw the beginning of an asset bubble back when the Dow broke above 4000 in early 1995. If we can make that case, then it is a full decade of abnormal returns, even with the tremendous drawdown suffered from 2000 to 2002. But unfortunately, a decade is sufficient time to have convinced the vast majority of participants that abnormally high returns are nevertheless, normal, and are a permanent feature of investing in U.S. stocks. In fact, nothing could be further from what history has shown to be true. Take the rolling average of decade-long returns dating back to 1907, for instance. Close to a century of history clearly illustrates that ex-dividends, a typical annualized return for the Dow Industrials over any ten-year stretch is just 5.2%. Then again, if you remove the effects of the mania and compute through 1994, average returns for decade-long holding periods are only 4.4%! Even with the mania included, annualized returns are under the 5% mark an amazing 52.4% of all rolling ten-year periods. Yet, at this date, the last ten years have averaged an 11.1% return and at their lowest in March 2003, were still 8.4%! However, if the market is ever to revert to what once transpired as normal, investors are in for quite a shock. If the Dow were to move sideways until roughly February 2007, ten-year returns would finally fall to the 5.2% average stated from 1907 to date. Of course, we are assuming a rather beneficial worst case, when a more realistic worst case might be a return to the zero percent level last seen in 1982, when the great bull market erupted. In that case, sideways movement will not bring prices into line until late August of 2009. Of course, prices need not move sideways. As history has shown, reversions to the mean have often occurred with price declines, such as the 1930s and the 1970s. Our long term target of Dow 6400 could conceivably mark the low point of this bear market, and the timeframe we have in mind points to October 2006 for the lows. That would take ten-year returns all the way down to 0.64% annualized, still above the zero line. Given that ten-year annualized returns have been under zero one-sixth of the time, we do not believe our worst case is any kind of a stretch at all.
A double bubble? Double the potential for eventual trouble? Probably. Ironically, the Fed could conceivably luck out again this year and next. With the economy moderately robust, the Fed will most likely begin hiking rates soon. We do not expect the markets nor consumers to react well to any rate hikes as massive debt is still overwhelming consumer balance sheets. Thus, the Fed would once again be forced to cut rates but could cut from higher levels than now. This may yet allow the markets to muddle through another year and change before the long term lows we have in mind come irrevocably closer. The most astounding aspect we can report is that there has been virtually zero mass media coverage of the stock market mania, likely the greatest mania of all time. There is even less reportage of the echo, the double bubble. Or can it be that valuations have permanently changed and are now quuite normal? We'll let the Sage of Omaha speak for us yet again. Warren Buffett, commenting upon Berkshire Hathaway's huge cash hoard, "Our capital is underutilized now, but that will happen periodically. It's a painful condition to be in - but not as painful as doing something stupid." We couldn't possibly say it any better.....
High
Targets for 2004 (moderate odds):
Low
Targets for 2004 (moderate odds):
Long
Term Targets for ultimate bear market low - more likely to occur in 2006
THE CONTENTS OF THE ENTIRE WEBSITE ARE COPYRIGHT 2004 ALAN M. NEWMAN I hope you have enjoyed your visit and please return again. If you know anyone who might be interested in seeing what we have to offer, we'd be happy to have them visit as well! Alan M. Newman, May 5, 2004 All information on this website is prepared from data obtained from sources believed reliable, but not guaranteed by us, and is not considered to be all inclusive. Any stocks, sectors or indexes mentioned on this page are not to be construed as buy, sell, hold or short recommendations. This report is for informational and entertainment purposes only. Longboat Global Advisors, Alan M. Newman and or a member of Mr. Newman’s family may be long or short the securities or related options or other derivative securities mentioned in this report. Our perspectives are subject to change without notice. We assume no responsibility or liability for the information contained in this report. No investment or trading advice whatsoever is implied by our commentary, coverage or charts. |
