HOME | SUBSCRIBER SECTION | CHART OF THE MONTH | TECH OUTLOOK | COMMENTARY | LINKS | CONTACT US | ARCHIVES
|
- THE GREATEST STOCK MARKET MANIA
OF ALL TIME -
DATED MARCH 11, 2015 A SPECIAL REPORT BY ALAN M. NEWMAN, EDITOR CROSSCURRENTS This free feature is now updated only three or four times each year. Our next update will probably not be published until mid-to-late July 2015 |
|
since we first published this website on January 15, 1999. Our readership spans 185 countries.
Our paid
subscription stock market newsletter has only two rationales for its existence;
Please check out the testimonials on our Kudos page. Printable
files of this report accompanied by our forecast are available only to
paid subscribers.
and are chosen for their timeliness and relevance. Why The Stock Market Should Crash In 2015 REPRINTED FROM THE DECEMBER
29th ISSUE OF CROSSCURRENTS
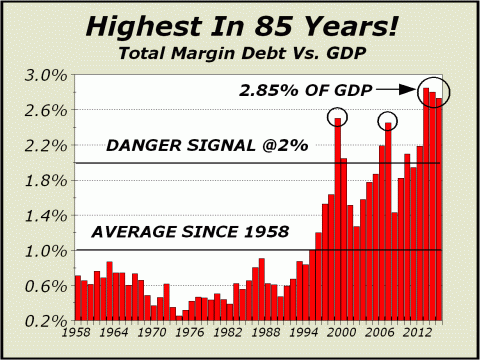
Perhaps the most salient point we can make about U.S. equity prices is the extent of leverage that has been required to support current valuations. Clearly, leverage in the form of margin debt was the cause of the collapse in 1929, as even a ten-percent correction was sufficient to completely wipe out the most leveraged investors. Once the rush for the exits commenced, there was no stopping it. The experience was so daunting that it altered the mind set of investors for decades to come. The suppression of memory lasted until stocks once again went a bit bonkers in 1987 and margin debt briefly extended as high as 2% of total stock market capitalization, double the average of the previous three decades. However, a super bull secular cycle for stocks had commenced only five years earlier and was still in place, thus the crash had a limited impact despite the violent moves of October. In fact, the last line of your Editor’s December 3, 1987 commentary read, “Only one course of action is dictated. Buy stocks.” The next three days were huge moves up and the bull was once again in fine form. And once again, the mind set of investors was altered, but this time, any fears of vulnerability were replaced by the confidence of invulnerability as the Federal Reserve stepped in and promised to take whatever measures were necessary to preserve the markets. In fact, the Greenspan Put was born. In this manner, excessive leverage became acceptable and by March 2000, in the midst of a veritable mania for technology stocks (the first circled highlight on our featured chart), margin debt once again extended to extraordinary levels. Over the next 30 months, as stock prices were halved, margin debt fell by 54.6%. But the cycle of madness easily repeated only seven years later and after margin debt soared to new records, stocks collapsed by half while margin debt fell 52.1% in only 19 months. And of course, the Fed then stepped in again and since that time, we have been graced by no less than four rounds of accommodative policies expressly designed to drive asset prices as high as they need to be for full employment and the end of poverty.
But a strange thing has happened on the way to this contrived nirvana. The upper class has wound up with a far larger share of wealth, the middle class has fallen on much harder times and poor Americans are much worse off; incomes and assets have dwindled and the number of Americans requiring food stamps hit new records for many months. As for full employment, the labor participation rate is still near 35 years lows. At the same time, risk as defined
by the “DANGER SIGNAL” on our featured chart,
Something is dreadfully at odds with how economic prospects are now measured by the various pronouncements we hear from government and the way they would traditionally be implied by the very same statistics in the past. There seems to be no such thing as bad news and whatever we hear takes on a positive spin by the application of propaganda. Andrew Huszar has recently apologized (see http://bit.ly/13Vuzxo) for his 2009-2010 management of QE, noting that it has done next to nothing for the man in the street while being “the greatest backdoor Wall Street bailout of all time.” Stanley Druckenmiller, one of the great hedge fund investors of all time said “This is fantastic for every rich person. This is the biggest redistribution of wealth from the middle class and the poor to the rich ever.” Worst of all, our government is now so complicit in the scheme that there appears to be little hope for whatever remains of the middle class. On December 11th, the House passed a bill repealing the Dodd-Frank requirement that risky derivatives be pushed into the larger banks subsidiaries, heeding the repeated suggestions of JPM’s CEO Jamie Dimon who has railed constantly about anything that might be the slightest bit harmful to big banks (see http://bit.ly/1zpzXFU). The upshot is that most of us will be on the hook for inevitable cataclysmic derivative losses down the road. The truth of the circumstance is that the blackest and bloodiest of all Black Swans is lurking out there. Heaven forfend that swan swims in the direction of America’s favored classes. Our law makers will continue to play loose with our future because it suits those who contribute the most to their election coffers and it suits everyone in the upper class, which includes most of those who make the laws in our country. The median net worth of U.S. Congresspersons is now over $1 million.
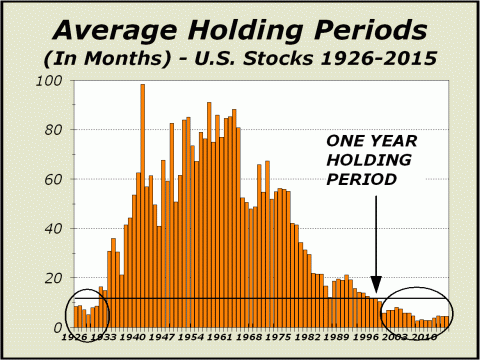
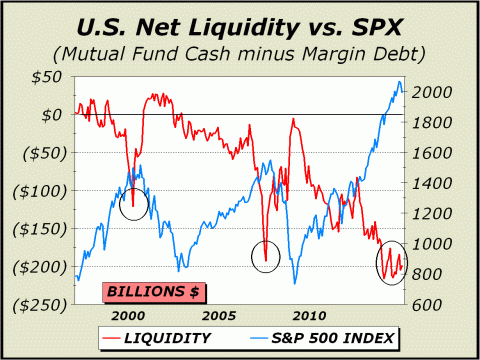
We can only repeat what we have said on so many occasions, that stock market risk and indeed, systemic risk of the entire financial system is at levels that preclude one iota of sanity. We are off the rails, totally bonkers and totally ignorant of what our future inevitability holds. Above, we present an updated look at a signal so patently clear that we termed it way back in the March issue as our “The Chart of the Year.” Below, the same circumstance from another perspective. Any way you slice it, we are now in the midst of a third fantastic phase of mind blowing exposure to risk. Ironically, despite the enormous gains of the last five-and-a-half years, traditional mutual funds cannot compete. Active management requires individual stock selection utilizing tried and true methodologies for valuations, but as we have shown before many times, with time horizons compressed as they are today, there is no need to value stocks because they are probably only going to be held for weeks, perhaps only days, perhaps only hours or even minutes. Playing momentum, rather than value, has resulted in a self fulfilling strategy. Prices go up, reinforcing momentum players to buy more and the cycle simply repeats and repeats.
Active managers cannot compete if they keep cash on the sidelines as they traditionally have done, thus cash reserves have been minimized for the last five years. Until this new regime dictated by momentum and the abandonment of valuation commenced, cash reserves averaged 8.3% over time, from a minimum of roughly 4% when stocks were hot to as high as 12% when stocks were anathema. Since 2000 and the permanence of manic behavior, cash reserves have averaged only 4.3%. And in the last 26 months, cash reserves have never exceeded 3.9%. The Shiller P/E, also known as CAPE (cyclically adjusted ten-year P/E) is at 27.35, topped only in 1929 and 2000, coincident with two of the greatest downside reversals in stock market history. Coupled with margin debt at levels greater than anytime in history except 1929, the coincidence is too striking to ignore. We are at the exact same circumstances
that prevailed
Groupthink has provided a consensus
that excessive risks are acceptable,
We crashed in 1929, 2000 and 2007. Clearly, the same catalysts for a crash are in place today.
The Decennial Cycle
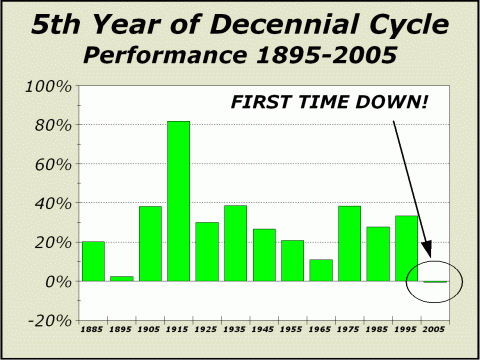
The fifth year of the so-called Decennial Cycle has been so impressive that analysts flock to it like mana falling from the sky. We were once in the same camp, so impressed that we maintained a bullish stance in 1995 partly due to what we saw as fantastic consistency. However, in reality, all we saw was coincidence. Given the fifth year of a decennial cycle does not coincide with the presidential or any other relevant cycle, why should it have any impact at all? Thus, contrary to the consensus analyses that we saw for the year ahead in 2005, we relied on all the other evidence, called for a significant decline during the year but allowed “….we believe the calendar year should finish slightly higher.” We were wrong by one day as the Dow Industrials closed higher on the next to last day of trading but closed a few points lower on the final day of trading of 2005.
Looking at the year ahead in 2015, we see nothing constructive on the horizon. Amazingly, we have already seen several bullish comments from analysts relying on this faux cycle for stocks in 2015. Faux cycle? Yes, faux cycle. History has shown that stocks are up on average roughly seven of every ten years, thus a string of a dozen consecutive plus years for any timeframe we might measure, such as the fifth year of the Decennial cycle, is not all that unusual. In fact, from 1985 to 1999, the Dow finished higher every year but one. The previous fantastic performance
of years ending in 5 appears
At some point in 2015, we expect prices to be at least 20% lower.
Stockzilla!
Godzilla grew to monstrous size and gobbled up everything in its way, trampling on automobiles and destroying buildings in its path. If you will allow a bit of artistic license, the Stockzilla that ruled the world at the momentous peaks of 2000 and 2007 had a similar effect. The beast toppled the economy into recession on both occasions and nearly caused a complete financial collapse in the latter instance. The peaks came seven years and seven months apart and we suppose it is conceivable we might again stretch to the same time extent before we see Stockzilla unleashes the final act of his destruction. Although that would equate to the possibility of higher prices until as late as Thursday, May 7, 2015, the only circumstance we see that even remotely suggests the top might still be 92 trading sessions away is the consensus.
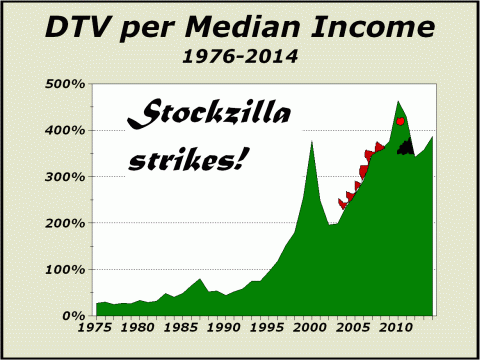
As of Christmas day, total dollar trading volume (DTV) was running at a rate of $66.6 trillion, 2.5% higher than the previous record in 2010. For every dollar the country generated in gross domestic product, $3.85 were traded in stocks. If you thought the tech mania in 2000 required the last iota of frenzy, then consider that DTV is more than double the rate of trading in the glory days of that tech madness. Frankly, we are continually astonished that renewed pictures of the mania are routinely ignored like it is all in the normal course of events. It’s not just strange.
It’s not just bizarre.
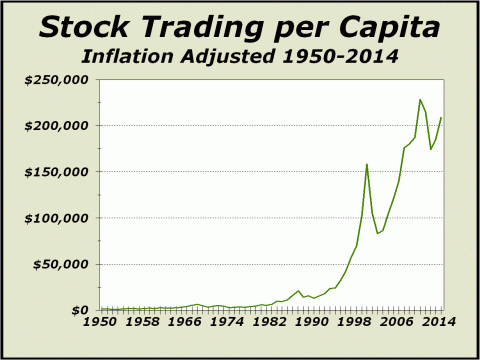
Above, we see just how phenomenally trading has inflated. When we first went over the data, it was so far removed from normal that our first notion was we must adjust for inflation. Unfortunately, that really didn’t change much as the picture was still uncomfortably….shall we say monstrous? Although the perspective at lower right is identical, we felt it best to show both to accentuate just how far Stockzilla has traveled to rule the markets today. The great secular bull market for stocks erupted in 1982. At the previous peak for DTV in 2010, stock trading per capita was as high as $228,415. As of today, stock trading per capita is still $208,850. The statistics are astonishing. Adjusting for inflation back to 1950 clearly illustrates how Stockzilla now dominates the landscape. The great secular bull market commenced in 1982 and until 1999, just before the tech mania bubble popped, trading averaged a mere one-eighth of today’s level. In that same period, trading averaged 84% of median income. Today, it averages 387% of median income and was as high as 464% of median income. We are in the midst of the
third veritable mania in the last 14 years.
Stockzilla is here and is doing what he knows best.
Truly In The Land Of Oz
The most distressing aspect of the so-called bull market for stocks is that earnings are not being used to improve the companies but are instead being put to use for the worst of reasons. A few months ago, Bloomberg reported that 95% of the earnings for companies in the venerable S&P 500 index were devoted to stock buybacks and dividends, not investments in the future (see http://bloom.bg/1xVD8V1). This is not just a one-off event. The article also shows the proportion of cash flow used for stock buybacks has nearly doubled over the last decade, obviously at a cost to capital improvements. It is any wonder that the labor force participation rate is the lowest it’s been since 1978? In this era of central bank largesse, there is no basis nor justification for companies to spend money on their future. The Factset Buyback Quarterly provides several additional points to consider (see http://bit.ly/15Dpb27). Nearly 75% of the S&P 500 constituents participated in buybacks during the third quarter, so we know this is the rule, not an exception. The total spent on share repurchases over the trailing 12 months was $567.2 billion, a year-over-year increase of 27%. Now we know how stocks can rise despite suffering outflows from domestic mutual funds for years. Dating back to 2007, outflows from domestic equity mutual funds total $633 billion. Apparently, the principal drivers of the bull market in stocks are the S&P 500 companies themselves! If this is not the ultimate in irony, we can’t imagine what is. Then again, given an environment in which executives prosper from option grants, there is every incentive to raise the price of their shares by any means.
Thus, for the corporation, it matters not if the shares are theoretically overvalued or not. Spending cash from the corporate treasury on capital improvements entails risk. Demand is a powerful tool. By spending cash on the company’s stock, higher share prices are guaranteed. Shareholders are certainly not going to complain. And those executives at the top with generous option grants and directors will not complain. And best of all, buying back shares ensures profitability improves. What an imbecilic development this is! Corporate wizards can now produce a bull market and manufacture money at will. We are now truly in the land of Oz.
The Bubble Diverges
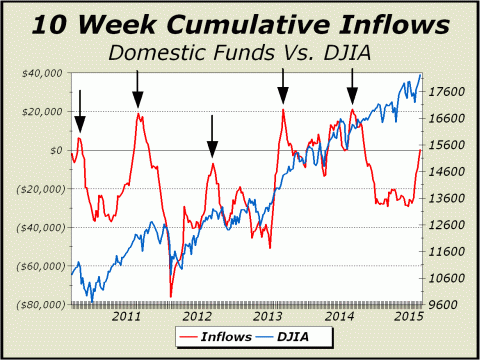
Demand via 10-week inflows for domestic mutual funds has obviously not been responsible for the bull market. Our line is below zero far more often than above. Curiously, the previous highs in 10-week demand from inflows into domestic mutual funds have all tended to fall around the end of each year. However, as of now, the 10-week average displays a huge negative divergence from the prior peaks. We believe this is a very significant development; a growing recognition of an excessively overvalued market.
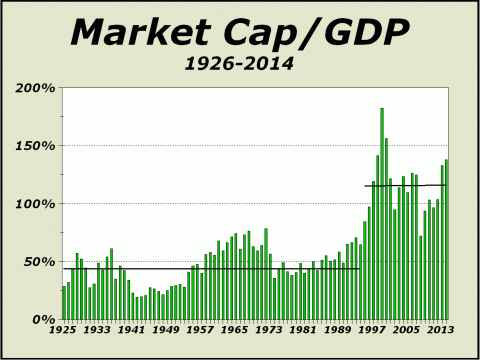
Again, we point to a commentary from John Hussman (see http://bit.ly/1BzggHQ—Dec.29th). As we illustrate below, total stock market capitalization versus GDP is well over double the historical average of 62.4% and nearly triple what the average was for 70 years from 1926-1995 (see lower line). Since that point, much higher valuations have been tolerated (see upper line) but not for long as the two tremendous bear markets of 2000-2002 and 2008-2009 amply proved.
A return to the norm since 1996 equates to prices 16% lower than today. A return to the historical norm equates to a 55.2% collapse.
OUR EVENTUAL
TARGET REMAINS DOW 14,719
WE STILL
HAVE AN OPEN BEAR MARKET TARGET OF DOW 12,471
We also believe the March 2009 low of Dow 6469 will likely to never be seen again.
THE CONTENTS OF THE ENTIRE WEBSITE ARE COPYRIGHT 2015 CROSSCURRENTS PUBLICATIONS, LLC I hope you have enjoyed your visit. Please return again and feel free to invite your friends to visit as well. Alan M. Newman, March 11, 2015 The entire Crosscurrents website has logged nearly 4 million visits. All information on this website is prepared from data obtained from sources believed reliable, but not guaranteed by us, and is not considered to be all inclusive. Any stocks, sectors or indexes mentioned on this page are not to be construed as buy, sell, hold or short recommendations. This report is for informational and entertainment purposes only. Persons affiliated with Crosscurrents Publications, LLC may be long or short the securities or related options or other derivative securities mentioned in this report. Our perspectives are subject to change without notice. We assume no responsibility or liability for the information contained in this report. No investment or trading advice whatsoever is implied by our commentary, coverage or charts. |
|
|
