HOME | SUBSCRIBER SECTION | CHART OF THE MONTH | TECH OUTLOOK | COMMENTARY | LINKS | CONTACT US | ARCHIVES
|
- THE GREATEST STOCK MARKET MANIA
OF ALL TIME -
DATED MARCH 3, 2014 A SPECIAL REPORT BY ALAN M. NEWMAN, EDITOR CROSSCURRENTS This free feature is now updated only three or four times each year. Our next update will probably not be published until mid-July 2014 |
|
Our readership
is world-wide.
This report
is foremost a compilation of articles that have previously appeared in
the Crosscurrents newsletter.
Please check out the testimonials on our Kudos page. Printable
files of this report accompanied by our forecast are available only to
paid subscribers.
DON'T
FEEL LIKE COMMITTING TO A LONGER TERM? SPECIAL 3-ISSUE SUBSCRIPTION
OFFER:
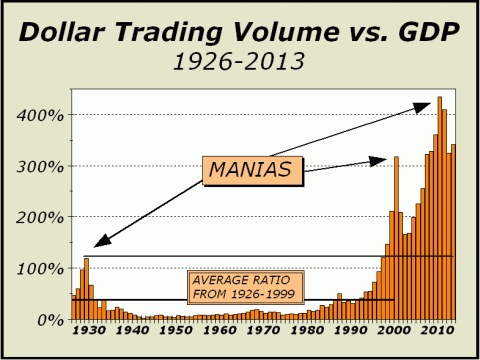
The rules of the game are in the process of changing as the Federal Reserve begins to taper their strategy of increasing their own portfolio holdings. This strategy is primarily responsible for the five year long bull market and there was no way it could last forever. The stage has been set for the end of the bull run. The run has endured for so long and has been so successful that even *after* five years and a spectacular run of close to 10,000 Dow points, a significant number of analysts have called 2014 the *start* of a new secular bull market. That's the kind of silly stuff you hear in the midst of a veritable mania. We have updated our data through the end of 2013. Total dollar trading volume (DTV) was $57,434,509,996,937, the third highest in history, surpassed only in 2010 and 2011. For every dollar generated in gross domestic product (GDP), stocks traded $3.41. Until 1997, DTV had been above GDP only once, and that was in 1929. The ratio has averaged $2.67 since 1997 and we have suffered two stock market crashes with significant economic impact. It is difficult to even posit what normal is now. Suppose we take the entire period from 1926 to 1999 and classify that as normal. Thus, we extend from three years before the Roaring Twenties peak, through a depression, a World War, and a tremendous expansionary phase from the end of the War until there was no doubt another mania was in place. This is the way history usually looks. Long multi-generation periods of simple baseline activity is not the standard. You see pretty much the same as you see from 1926-1999. During this period, DTV averaged only 40% of GDP. Stocks were important but were not the end all. Clearly, they are now.
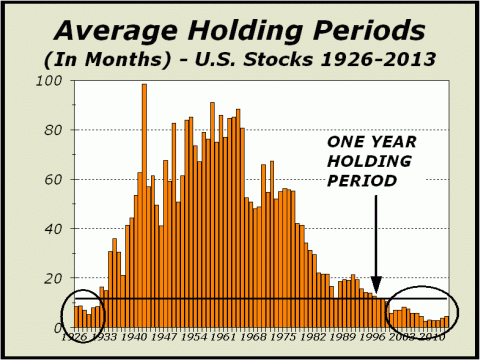
On December 5, 1996, Federal Reserve Chairman Alan Greenspan’s speech before the American Enterprise Institute for Public Policy Research in Washington, D.C. implied “sustained” low inflation was responsible for “higher prices for stocks,” but asked the following: “….how do we know when irrational exuberance has unduly escalated asset values, which then become subject to unexpected and prolonged contractions as they have in Japan over the past decade?…. We as central bankers need not be concerned if a collapsing financial asset bubble does not threaten to impair the real economy, its production, jobs, and price stability…. we should not underestimate or become complacent about the complexity of the interactions of asset markets and the economy.” Despite their own good advice, the Fed has constantly underestimated and become complacent about the stock market, allowing risk exposures to run to repeated new highs in the quest to create wealth. Typically, higher risk exposures occur when the focus shifts dramatically to the short term. When risk is low, one can sit back and wait out the tough times. In high risk periods, one must be prepared to sell at a moment’s notice. We have reached a point at which trading is so short term oriented (see chart at bottom right page two) stocks no longer trade with traditional valuations in mind. Clearly, this is how DTV more than tripled into the 2000 peak and Nasdaq traded at a collective 250 P/E.
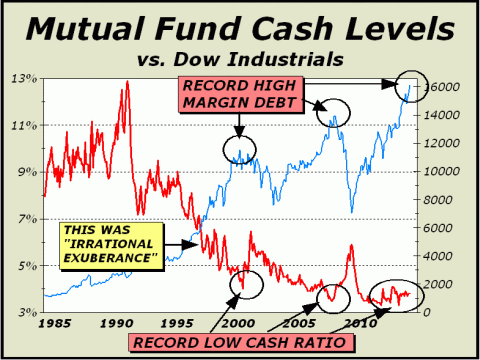
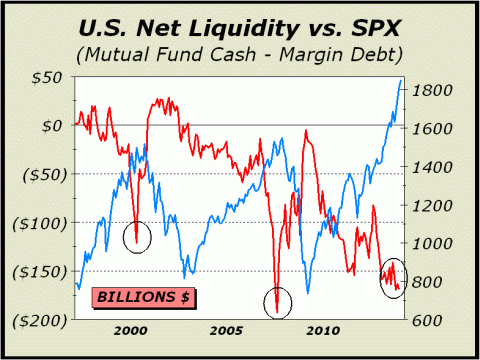
In his speech, Greenspan used the Crash of ‘87 as an example of a bubble of no consequence because it did not have a lasting impact on the economy, but 1987 was a far different beast than 1999-2000 when the Fed stood back and did nothing as tech stocks soared to impossible prices, margin debt hit a new record and cash assets fell to a record low as a percentage of mutual fund assets. The Fed completely underestimated the “complexity of interactions” and their own complacency. They were equally complacent in 2007 as mutual fund cash reserves plunged to a new all time record low and margin debt once again hit a new all time record high. Both instances were clear indications of a veritable mania yet the Fed completely underestimated the fall out to come. The current instance highlighted in our chart at lower left is a replay of the prior two circumstances but is in reality, a far worse situation since it is accompanied by the worst sentiment numbers in decades, most prominently the stance of investment advisors, who briefly moved as high as 61.6% bulls and the next week moved as low as 14.1% bears. The gap between bulls and bears surged to as high as 43% in October 2007, one week after the peak in prices. In 2011, the gap surged to 42% before a correction that nearly took the Dow into bear territory. In the last two weeks of 2013, the gap was 46%, which we believe is additional evidence of a mania. We also believe this near universality of opinion spells the end of the bull phase that commenced in March 2009.
What is most striking about the chart is that the mutual fund cash ratio has remained so low for so long. At the 2000 peak, the ratio tied a 27 year old record. In 2007, the ratio briefly fell to another new record low 3.5% and a one year moving average of the ratio remained below 4% for 13 months. Within seven months of the 2009 bottom, the ratio was again below 4%. The one year moving average
fell below 4% in April 2010
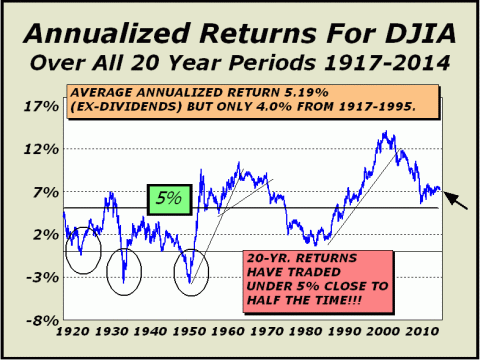
We can only reiterate our conviction this must play out very badly. Reward is not a permanent feature of the risk/reward equation! Over the course of history, depending upon interpretation, stocks as measured by the Dow Industrials, have grown at a rate of 4% to 5% per year. There are times they grow at a greater pace and times they grow at a lesser pace but the average since 1917 has been 5.19% for all rolling 20-year periods. However, the great bull market from 1982 has had an outsized impact. For 78 years from 1917 to 1995, stocks averaged only 4% over all 20-year rolling periods. The average currently stands at 7.33% and has been above 5% for the longest period in the history of our chart. There is every reason to consider that stocks will return to the long term average and quite possibly go far below the average as has occurred in the past. We have outlined many times in our Pictures of a Stock Market Mania reports (see www.cross-currents.net/charts.htm) how this might take place. A crash to Dow 12,593 in short order would do the trick, taking our average to exactly 5%. Or, if prices simply move sideways from a nice round number, say Dow 16,000, we’d have to wait until October 2016. However, given the 78 year history of 20-year rolling periods averaging 4%, perhaps that’s the case we need to examine as the third mania in 14 years eventually comes to a screeching halt. If that is the case, a crash to Dow 8389 is required. While an unlikely happenstance, it is possible and would result in the third episode of prices being cut in half. If only patience is required from Dow 16,000, we need to wait until May 2017. Of course, the benchmarks may be achieved with any number of iterations of price decline and patience and that is our point. The next bull market will likely not occur until we see a combination of both a decline in price and the passage of time, perhaps a few years.
Fed policy to build wealth can only work if targeted to the long term, but their actions are clearly directed towards short term trader objectives. Valuations are way out of line. The S&P is trading at a P/E of 19.5. One year ago, the index traded at a 17.5 P/E, equivalent to a drop to Dow 14,566 and coincidentally, 1% below our current correction target of Dow 14,719. Given a still tepid economy that has no reason to improve despite the Fed’s willingness to allow risk to expand, we feel constrained to point to another possibility; a return to a historic norm approaching a 15 P/E, equivalent to Dow 12,472 and coincidentally, only one point away from our bear market target of Dow 12,471.
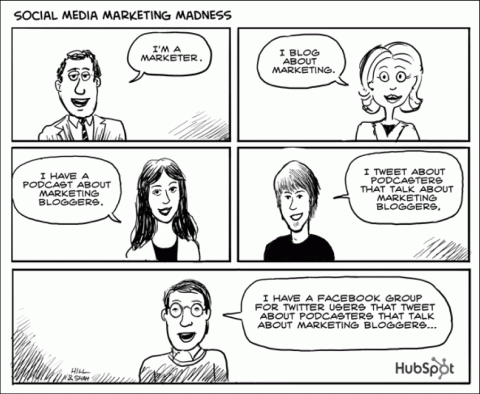
The following was the lead article in our December 2, 2013 issue. Tech Mania Redux. For an old guy, your Editor is pretty hip. A tech geek, a fan of all the latest gear, a former computer programmer with professional credits, and most of all, a firm believer in capitalism. What we don't get is the impetus for yet another mania, the third extensive episode of insanity evidenced in 13 years. What we don't get is the lunatic fascination with companies that lose money consistently. What we don't get is how some of these companies are ever supposed to make money. For instance, Twitter. Your Editor has a Twitter account that was established years ago just to see what his two kids were "tweeting," a practice known to the younger set as "trolling." Not much to see. Tweets are comprised of no more than 140 characters, not much in the way of graphics, sometimes accompanied by a “hashtag” to indicate relevance to a certain subject. A hashtag would be something like "#techmania" appended to a Tweet by your Editor, such as "how in heaven's name is Twitter worth $25 bil?!" Tweets are meant to be glanced at, as opposed to read, but some advertisements appear as Tweets between those of persons a member "follows." Thus, in a list of tweets from your buddies John, Andrea, Max and a message from your gym, there might be a Tweet ad for an upcoming video game you mentioned in a Tweet last week. While we won't deny the ads might afford a modest penetration, they clearly cannot be all that informative and as a result, cannot be all that attractive to advertisers. By the way, TWTR lost $64 million in their last quarter. Thus, despite our geekiness, we are relegated to those with no faith in Twitter's business plan. Twitter can only be worth $25 billion as a result of a veritable mania that places phenomenal and unattainable valuations on companies so far in excess of what they might actually be worth that investment in their shares must be considered pure unadulterated madness. Let us reiterate the principal factor about TWTR's concept. It is supposed to divert users attention for only a brief moment, glanced at, not read. However, for full disclosure, it is imperative to offer a more complete compendium of basic facts about the roster of current tech mania darlings. Any insider transaction data shown is for just the last six months. Zynga (ZNGA) is now worth $3 billion and has lost $614 million in last two years on $2.4 billion in revenue. Revenue was up only 2.4% last year and in the last six months, a total of 40 insiders sold 2,144,760 shares. There were no buyers. Amazon (AMZN) is valued at $163 billion but $143.36 billion in revenue over the last three years generated only $1.744 billion in profits, one-third the profit margin of Walmart. WMT trades at a 15 P/E, AMZN's expected forward P/E is 147. 25 insiders sold stock worth roughly $88 million. There were no buyers.
Facebook (FB) now has 1.2 billion accounts, one sixth as many people are on the face of the planet. The forward P/E is 43.3, price to sales ratio is 16.8. The former is quite high, the latter is absurdly high. 64 insiders have sold 9.5 million shares worth roughly $380 million. There were no buyers. Tumblr is the opposite of Twitter. If you have more than 140 characters on your mind, you can write as much as you like on Tumblr, a micro blogging site with close to 140 million blogs, a sizable fraction of which relate to porn. Another criticism of the site is the ability of users to violate copyrights plus spam and security issues. According to the most recent report we have seen, Tumblr had $13 million in revenue in 2012 and hopes to book $100 million in 2013. The company spent $25 million to fund operations in 2012. Yahoo paid more than ten times anticipated revenue for the company with no prospects for profits for the foreseeable future. Good luck with that. YHOO itself is quite pricey at 7.5 times sales. Insiders sold 11.1 million shares in the last six months. There were no buyers. Pinterest is a photo sharing website that has grown from 12 million users in January 2012 to 70 million today. It's not just people anymore, it's also businesses creating pages aimed at promoting their businesses online. Meanwhile, zero revenue has been reported yet the company is now valued at $3.8 billion (see http://bit.ly/1biNFLb). Pinterest is not yet a public company. Yelp (YELP) hasn't made any money yet, but is expected to make a little bit next year and thus trades at a forward P/E of 330. Bear in mind "forward" is a projection and not a guarantee. Price to sales is astronomic at a ratio of 20 to 1. The business is driven by users posting their own reviews and ratings of local eateries and pubs and how typical, hopes to sell advertising. The company has some problems with some reviewers panning the competition and others loving their own eateries, making the info less reliable. And again, a service that is designed only for brief references by consumers. 64 insiders have sold 5.4 million shares probably worth more than $320 million. There were no buyers. LinkedIn (LNKD) is worth $25.6 billion, one-third more than it was four months ago and double what it was nine months ago. The forward P/E is 96. Again, "forward" is only a projection and may be way off. LNKD members create, manage, and share their professional identity online. Recruiters and corporations pay for "enhanced" offerings from LNKD listings accounting for roughly 53% of income. Meanwhile, insiders have sold 2.7 million shares worth somewhere in the neighborhood of $540 million. There were no buyers. Perhaps the most incredible of all is Snapchat, not yet public, but planning an offering that will place valuation at $3.5 billion. Snapchat’s claim to fame (and apparently, fortune) is a service for mobile devices that allows one to send pictures, videos and texts to friends that expire anywhere from one to ten seconds later, thereafter hidden from the receiving device and deleted from Snapchat’s servers. We have no clue where revenue will ever come from and frankly, foresee no business model that can possibly work. A Yahoo poll making the rounds on November 7th when Twitter (TWTR) took its shares public asked investors if the price would double from the initial offering price by the weekend. Fully half said "Not very likely." Meanwhile, the shares hit $50, nearly doubling in only seven minutes. In that brief span, TWTR gained $14 billion in market cap based on the same kind of insanity that drove the South Sea bubble, Tulipmania, the Roaring Twenties the great tech mania of 1999-2000 and the housing bubble in 2007. The only difference is time compression.
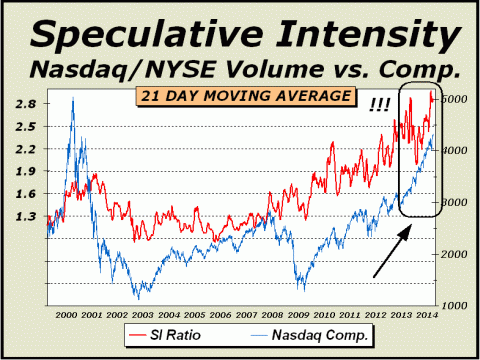
Nasdaq is the primary stock exchange for all the companies mentioned in this article and it is clear that speculation has ramped up as prices continue to run to new highs on an almost daily basis. The constant attraction of quick riches has resulted in a huge increase in the ratio of Nasdaq volume to NYSE volume in recent years. Despite two burst bubbles and the Composite Index still nearly 30% from a new all time high, Nasdaq’s share of overall volume has roughly doubled versus the venerable NYSE. From late 1999 into the March 2009 low, the ratio averaged 1.24, has averaged 2.43 this year and currently stands at a robust 2.58. Edit: the chart above has been
updated.
Most importantly, our analysis shows liquidity has fallen to its lowest level since July 2007, only three months before one of the biggest price peaks and reversals of all time. Dating back to at least 1997 and more likely, decades ago, liquidity has been lower in only two months, June and July 2007. The extent of the present mania does not precisely match the two before but history usually rhymes, rather than repeats exactly. The only consequence that logically follows is for the present bubble to burst quite soon. We expect at least a 30% downside for Nasdaq.
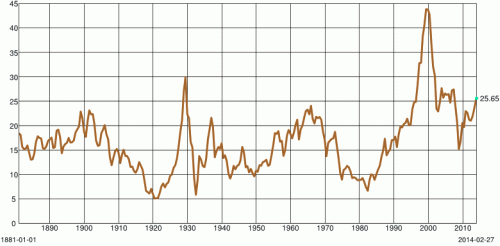
The following article has been updated from our previous report in November 2013. Shiller Revisited. Since our last report, along with prices, valuations have gone to even wackier extremes. Below, the current chart for a ten year average of P/E ratios made popular by Robert J. Shiller in his book, Irrational Exuberance (see www.irrationalexuberance.com/). The current 25.65 reading was matched only in the Roaring Twenties mania that ended spectacularly in 1929 and the mania beginning in the late 1990s. Now, even the broad based bull that took the Shiller P.E to sky high levels in 1966 has been left behind in the dust. The two huge declines into the 2003 and 2009 bottoms are patent evidence of the inevitable necessity for fair valuations.
Dating back to 1880,
The mean represents more than 35% decline in prices from today. Is it possible? Who would have thought that prices would have been halved into both the 2002 and 2009 bottoms? Yes, it is possible. Even a modest retracement to a Shiller P/E of 20 would result in a bear market with a 22% decline in prices. This should be the very least we expect.
THE CONTENTS OF THE ENTIRE WEBSITE ARE COPYRIGHT 2014 CROSSCURRENTS PUBLICATIONS, LLC I hope you have enjoyed your visit. Please return again and feel free to invite your friends to visit as well. Alan M. Newman, March 3, 2014 The entire Crosscurrents website has logged close to four million visits. All information on this website is prepared from data obtained from sources believed reliable, but not guaranteed by us, and is not considered to be all inclusive. Any stocks, sectors or indexes mentioned on this page are not to be construed as buy, sell, hold or short recommendations. This report is for informational and entertainment purposes only. Persons affiliated with Crosscurrents Publications, LLC may be long or short the securities or related options or other derivative securities mentioned in this report. Our perspectives are subject to change without notice. We assume no responsibility or liability for the information contained in this report. No investment or trading advice whatsoever is implied by our commentary, coverage or charts. |
|
|
