|
- THE GREATEST STOCK MARKET MANIA
OF ALL TIME -
DATED MARCH 4, 2007 A SPECIAL REPORT BY ALAN M. NEWMAN, EDITOR CROSSCURRENTS This feature is now published on roughly a quarterly basis. Our next update will likely be published the second week of June 2007. |
|
A world map of readers from 145 countries can be viewed HERE. Run your mouse over each country! This report is now mostly a compilation of articles that have previously appeared in the Crosscurrents newsletter. Our paid subscription stock market newsletter has only two rationales for its existence; powerful commentary and unique perspectives that cannot be found anywhere else. Please check out the testimonials on our Kudos page.
Much of the following article
is excerpted from the February 20, 2007 issue of Crosscurrents,
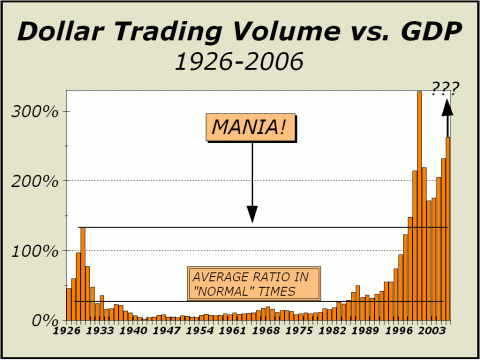
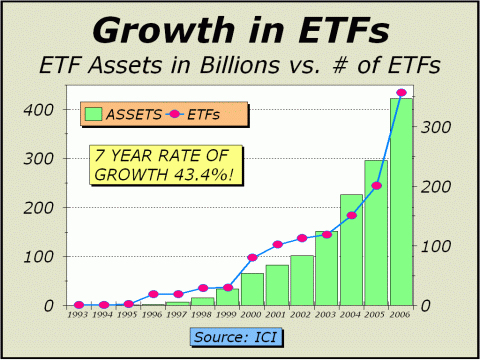
In preparing this update of our Pictures Of A Stock Market Mania feature, we were amazed to see how rapidly the trading velocity of Exchange Traded Funds (ETFs) has grown. ETFs are a large part of the reason why mutual fund cash levels are sinking and ETFs now apparently represent roughly one of every five dollars traded on exchanges in the US. Why is this fact so important? Significantly, not one of the purchases of ETF shares are made using fundamental analysis of the prospects for the individual underlying constituent companies. However, the products of mutual fund companies are those very same underlying constituent companies. The kicker is that ETFs are all stock and no cash, meaning they will tend to rise at a faster pace than mutual funds in a bull market. Thus, the only way mutual funds can compete with index funds and ETFs is to cut cash levels to the quick and buy regardless of valuation. Thus, we have a situation where the rationale for cash reserves continues to evaporate at an even faster pace as a still larger fraction of shares are purchased without regard to valuation. How big is the market for ETFs? In a word, enormous, far more enormous than in recent years. Dollar trading volume (DTV) in all markets has exploded, up more than 95% from the bear market bottom in 2002 to a new record, even higher than in 2000. If there is any saving grace at all to the renewed expansion of trading, it is that Nasdaq is not sucking up trading dollars as rapidly as before. In 2000, Nasdaq accounted for 62.7% of all dollars traded in U.S. markets. Last year, Nasdaq trading encompassed only 33% of all dollars traded. However, the lower percentage also has very much to do with the vast increase in dollar volume for ETFs, which have apparently become the trading vehicle of choice for the public and professionals. In 2000, Amex DTV totaled $1.1 trillion but the ETF market was considerably smaller. Since 2000, four of every five ETFs have been created along with 84.4% of ETF assets. The 25 largest ETFs listed on the Amex traded nearly $5.6 trillion last year. To put this number into perspective, consider that all U.S. markets traded less dollars in 1995. The largest ETF is the S&P 500 Spyders, which by itself traded nearly $2.5 trillion, more than all stocks traded in 1991. Unfortunately, trading has expanded with such ferocity that we now realize that we cannot be sure how all the numbers interact or tally. For instance, the New York Stock Exchange now reports not only totals for DTV of NYSE listed issues, but also totals for NYSE trading in “Nasdaq listed” issues, “ARCA & Amex listed” issues and finally, “All Exchange Traded Funds.” Those three additional categories encompass yet another $7.34 trillion, which implies we have substantially understated total DTV in the past. Given the Dollar Trading Volume chart below, what are we to make of claims that all is well, that no mania exists, and that prices can be easily justified? If we tack on the $7.4 trillion in additional categories provided by the NYSE, the last bar on our chart catches up to the arrow pointing to very near the 2000 manic peak. Even if we admit mutual fund companies do indeed, analyze individual company prospects and act accordingly, what percentage of buying and selling reflects analysis and not “trading” per se? Funds now only constitute 33.8% of total market cap and if we make the case that 30% are devoted to indexing or are closet indexers, less than one in four dollars is invested in stocks based on traditional economic analysis, whereas more than three of every four dollars are simply “traded.”
What are we to make of a market where individual companies have now been relegated to a tertiary status behind the indexes and sectors they comprise? The longer we trade markets where the valuations of individual companies are increasingly meaningless or suspect, the ultimate irony is that we will be able to place less reliance upon the valuations of the indexes or sectors the constituent issues belong to! What more proof could one possibly require that stocks remain perilously overvalued?
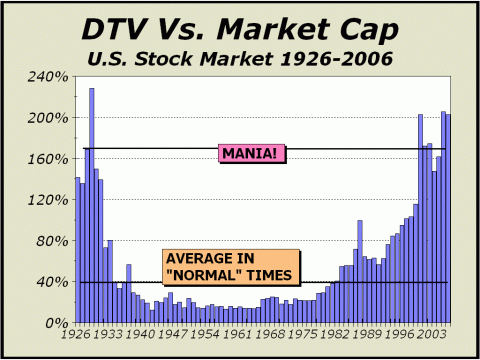
Finally, consider how DTV relates to total market capitalization. Can there be any possibility whatsoever that 1929 was not a genuine mania? We think not. While 2000, 2005 and 2006 are not precisely at the same level as 1929, we believe the seeds for the earlier mania had clearly been sown by the end of 1928 as the Dow had risen by 48.2% that year and by 90.8% since the start of 1927. Thus, the benchmark we have established at the level of 1928 is likely both fair and logical. Trading of this magnitude points to only one reality. A stock mania is still very much in place.
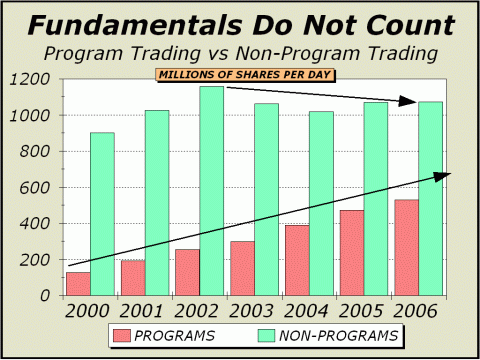
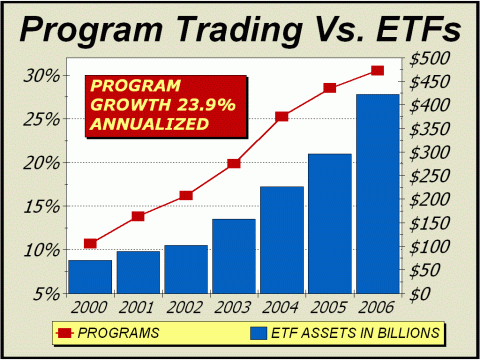
THE FOLLOWING IS EXCERPTED FROM THE JANUARY 29th ISSUE OF CROSSCURRENTS In the latter half of 2006, the New York Stock Exchange "adjusted" its methodology for determining the percentage of total volume attributable to the activity of program trading. The apparent reason was that in the week ending June 30th, programs were reported to be 92.8% of total volume, which would indicate that traditional investment activity had almost entirely disappeared. The huge surge occurred as various major indexes were rebalanced, requiring buys and sales for no fundamental reasons whatsoever. In fact, of the 896.1 million programmed shares transacted on the buy side and the 885.7 million programmed shares transacted on the sell side that week, we can say with perfect confidence that not one of those programmed shares was transacted due to individual corporate prospects. Interestingly, rebalances and changes often lag the market by so much that the moves are immediately suspect. Rather than go into detail as we have many times before, we'll simply refer you to http://tinyurl.com/yxy3b4 for Daniel Gross's explanation, as good as any. Then, for good measure, we'll throw in Jon Markman's analysis at http://tinyurl.com/y7effx, wherein your Editor is quoted. Just for kicks, we’ll point out that the biggest fraud in stock market history drew more indexed money into its shares as the deceit grew to monstrous. Programs routinely “traded” the shares of Enron as it soared to a market cap of more than $60 billion. So, there you have it, a market dominated by activity that has nothing to do with corporate prospects, just noise for the sake of the mathematics of indexing and other so-called strategies. Of course, the NYSE would wish to dispel any doubts that programs dominate, thus they adopted a new methodology to mollify you and I, thereby doubling reported trading volume in their computation. This treatment supposes that a program sale and program purchase are just two sides of the same transaction. The methodology change effectively halved reported program activity. Of course, the same presumptions must apply for non-program volume as well. If Aunt Edna buys 100 shares of XYZ from Uncle Harry, they are necessarily the same lot of shares. So why doesn't the NYSE just double all reported volume then? Because the transaction between Aunt Edna and Uncle Harry only involved 100 shares, not 200. Thus, while the NYSE reports daily volume of about 1.6 billion shares per day, for the sake of the program trading computation, they report about 3.2 billion shares per day. Only one or the other can be possible and whether the computation makes any sense or not, we believe the doubled volume numbers are reported specifically to present program activity in a more palatable light. Our chart below affords a totally realistic view of what is at work in the U.S. marketplace. As time passes, more activity is attributable to programs and less to investment. Note the chart is constructed using the new methodology. If anything, it should be obvious that NYSE shareholders must be delighted about the rapid increase in program activity, since higher volume translates to more profit. Heaven forfend an arena where trading activity for traditional investment is in a permanent state of decline or stagnation. Yet, it is. Four years of zero improvement in “traditional” trading volume is powerful evidence that individual investors have been emphatically pushed aside by the technology of indexing and the “sectoring” of the market. It is clear that no matter how we slice the stats, future growth for the NYSE will come from programs, thus they have totally embraced program trading over traditional investment activity.
Note how program activity has accelerated together with the rapid growth of Exchange Traded Funds (ETFs). [also see chart #2 on this page] Program volume has increased 120% since the end of 2002, roughly in line with the bear market bottom. In the same span of time, ETF assets have increased by 288%. The creation of so many ETF shares would not have been possible without programs and although each share purchased could only come as a result of a share that was sold, it can be logically argued that the demand to create ETF assets was so intense that the end result had to be to lift stock prices. The proof is certainly available. From the end of 2002, buy program volume outweighed sell program volume by 2.7%. Although the difference may appear small at first glance, we are referring to net demand of more than 2.5 billion shares, primarily those shares that have the most impact in their respective indexes and sectors. ETFs are formed for one purpose only; to present investors with more products, neatly packaged, and in the case of the S&P Spyders and the Nasdaq QQQQ, replete with TV and print advertising. Value is not a consideration in the creation of ETFs.
Fundamentals and corporate prospects are increasingly meaningless. The only argument in favor of the accumulation of equity at present is liquidity. And while that might be a great argument for investing while liquidity builds, fundamentals must take over at some point. We are compelled to point out that the greatest period of liquidity in history occurred in the first three months of 2000, as mutual funds raked in over $140 billion, before prices collapsed. Fundamentals finally took over as they again eventually must.
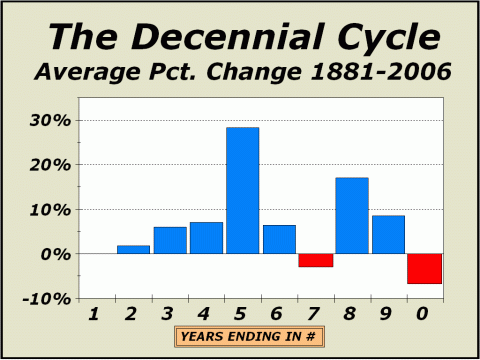
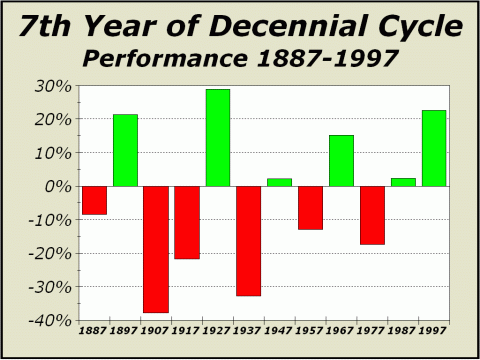
BELOW: ANOTHER ARTICLE FROM THE JANUARY 29, 2005 ISSUE OF CROSSCURRENTS Despite the common wisdom trotted about by Wall Street, one of the obvious truths about stocks is that there are good times to invest and there are bad times. While seasonal influences are strongly positive through the end of April (see November 6, 2006 issue of Crosscurrents), from the end of April to the end of the year may be another matter entirely. Years ending in “5” and “8” have been incredibly munificent, up 22 of 25 years and averaging gains of 23.6%. Even the three down years were tame, averaging less than a 2% loss. In fact, years ending in “5” and “8” have been so terrific that they have captured about 96% of all gains in stocks since 1885. On the flip side, years ending in “1”, “7” and “0” have on average, been relatively pathetic. Since 1887, years ending in “7” have averaged a 2.9% loss and half have been negative. The group is also the most manic-depressive of all, usually resulting in either a huge loss or a sizable gain. The six positive years averaged +15.4% and the six negative years averaged minus 21.8%. So, which will 2007 be, a manic year or a depressive one?
In looking for a pattern, we see only one factor that resembles the past and it stands out like a sore thumb. To wit, recoveries from previous bear markets leading to down years in 1907, 1937 and 1977. The three years from 1901 to 1903 lopped off more than 30% from the Dow; the market recovered smartly but then dropped 37.7% in 1907. The Dow was savaged by 80% from 1929 to 1932, again recovered smartly but then fell 32.8% in 1937. And in 1973-1974, the Dow shed nearly 40%, again recovered smartly only to hit 1977 like a brick wall and lose 17.3%. Given the recent 2000-2002 bear market and the halving of the S&P 500 and the subsequent recovery, the current year ending in “7” could well repeat as a loser. Thus, while years ending in “7” clearly have a manic/depressive character, we believe the evidence indicates a substantial possibility the year may end on a depressive note.
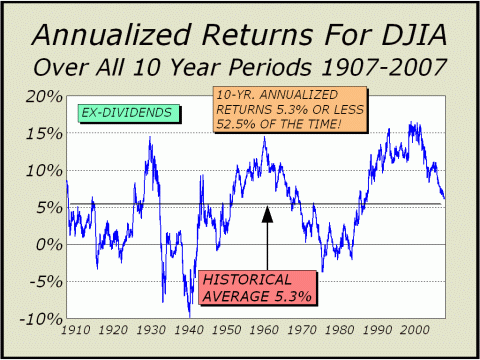
Returns Over The Decades Twice before, stocks entered the realm of fantasy, where longer term annualized returns were so high that practically everyone became a believer. Both during the Roaring Twenties and post-WW2, ten-year returns ran to nearly 15%, convincing participants that buying stocks could only turn out to be a good thing. They were wrong. As our chart clearly illustrates, ten-year returns traded sufficiently below zero after both eras to prove that there is no free lunch. Just for the sake of argument, if the permanence of 15% returns existed, how would any other investment asset be able to compete? Why would anyone ever buy Treasury bonds, Municipal bonds, Corporate bonds or preferreds? No need. Just buy stock. But there can never be a free lunch. With the potential for reward, comes the potential for risk. The historical average for ten-year returns has been 5.3% annualized (ex-dividends) for a sufficiently long time that we can infer permanence. A longer return in excess of that benchmark will likely be counterbalanced by a return below the benchmark. In fact, 52.5% of the time, ten-year returns have been below the benchmark average and they have been below zero an amazing 16% of the time, roughly one of every six data points! Annualized ten-year returns are still 6.1%, well above the benchmark. The good news is that the benchmark will be achieved in only three months if the Dow just trades sideways. With no further upside, it will remain at the benchmark for another seven months. However, since the Dow very recently traded at a record high, a return trip to zero will take pretty much the full ten years. We do not believe a round trip to zero is necessary but the point is clear. Returns were outsized for years
The tremendous growth in ETF trading and program trading argue vehemently against normal valuations. Programs do not analyze individual corporate prospects. The trustees that create new ETFs do not read the balance sheets of the constituent companies. Neither of them attempt to infer future profitability because there is no basis for them to make any assumptions. Programs have presented the financial world with another method to profit, but since positions might last only minutes, there is no incentive to invest, only to trade. ETFs are created simply to present the financial world with more new products. It's all about selling products and those with the new offerings can be very successful with the right pitch. Where does this all leave the investing public? Up the river without a paddle. Trading wins. That means investment loses. Do you really need to know any more?
We continue to maintain our forecast of an eventual and secondary secular bear market low target of roughly Dow 8900. This level equates to approximately SPX 1029 & Nasdaq 1809. It might be as much as another decade before a new secular bull market is capable of taking all of the major averages above the peaks achieved in 2000. While the Dow traded at a record new high recently, the SPX was still 6% away at its peak and Nasdaq traded up to less than half its all time high. Our 2007 high targets (see below) were made in recognition of the perfect record for the six months from November through April leading into pre-election years and these targets were nearly reached. The Dow traded to within 1.3% of our upside target, the S&P to within 1% and Nasdaq to within 2.5%. However, past the beginning of May 2007, when the "Dead Zone" returns once again, all bets will be off and we would expect the longer term influences of the secular bear market to dominate. For now, the potential
upside is likely to be the same high targets offered below
High
Targets for 2007
Low
Targets for 2007
The odds
greatly favor that at least a 10% correction from the highs
THE CONTENTS OF THE ENTIRE WEBSITE ARE COPYRIGHT 2007 CROSSCURRENTS PUBLICATIONS, LLC I hope you have enjoyed your visit and please return again. If you know anyone who might be interested in seeing what we have to offer, we'd be happy to have them visit as well! Alan M. Newman, March 4, 2007 All information on this website is prepared from data obtained from sources believed reliable, but not guaranteed by us, and is not considered to be all inclusive. Any stocks, sectors or indexes mentioned on this page are not to be construed as buy, sell, hold or short recommendations. This report is for informational and entertainment purposes only. Persons affiliated with Crosscurrents Publications, LLC may be long or short the securities or related options or other derivative securities mentioned in this report. Our perspectives are subject to change without notice. We assume no responsibility or liability for the information contained in this report. No investment or trading advice whatsoever is implied by our commentary, coverage or charts. |
