|
DATED MARCH 15, 2003 A SPECIAL REPORT BY ALAN M. NEWMAN, EDITOR LONGBOAT GLOBAL ADVISORS CROSSCURRENTS |
| When we last
published this update, it was early in the year and things were going well.
The Dow was up 5.3% in only seven trading sessions and the professionals
were eagerly nodding their heads in agreement about the new bull market
from the October lows. Surely, the January barometer would now show
solid gains ahead for 2003. Clearly, the year would be up, possibly
with substantial gains. Only a few days earlier, BusinessWeek had
published a year ahead forecast piece in which 64 of 67 investment "pros"
saw higher prices, placing median projections of plus 17.5% for the Dow,
plus 23.6% for Nasdaq and plus 25% for the S&P. In Barron's,
Abby Joseph Cohen reiterated her bullish stance (still bullish?!), offering
targets of 10,800 for the Dow and 1150 for the S&P. Other strategists
had lesser targets but most were still looking for substantial gains along
the lines of the 64 Businessweek bulls. But January turned lower
only three days later and hasn't yet looked back. Saddam Hussein's
Weapons of Mass Destruction were to blame said the pros. If only
we weren't going to go to war, nothing would hold back stock prices and
the new bull market could get going again. But then the pros told
us to buy stocks as soon as war started. Obviously, we would be easy
winners and with uncertainty out of the way, the new bull market could
get going again. Thus, there were only two circumstances. War
= buy stocks. No war = buy stocks. As usual, strategists and
professionals had devised a can't miss scenario for investors and refused
to admit the deeper problems rooted in the largest stock market mania of
all time.
Investment sage Warren Buffett recently pointed out two of those problems, that stocks still do not present good value at current levels, and his take on derivatives , "financial weapons of mass destruction." Both of these factors weigh heavily on the outlook for stocks. And even if the former problem were resolved with better values, it appears the latter problem will remain a genuine threat to the financial system.
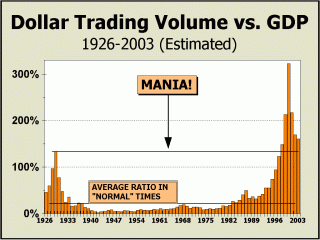
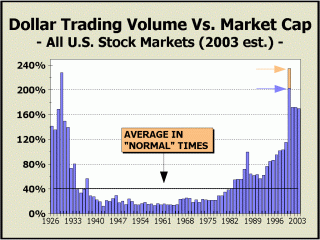
If we want irony, we can provide it. What we cannot present is the "official" chart of DTV since Nasdaq's statistics department has been in the process of cutting back spending drastically as the bear market unwinds and has stopped gathering the data. That's ironic! We have, however, been able to piece together what we believe are reasonable estimates using the same methods we adopted long before we began using the "official" Nasdaq tallies. We hope to be able to update with a more accurate rendering soon. For the meantime, it is quite apparent that Dollar Trading Volume still takes center stage. To show just how emphatic and lunatic the mania was, DTV has now been cut in half from the peak and is still far in excess of the peak in 1929! Most interestingly, the recent complaint heard everywhere was about the "light" stock market volume. Pretty much everyone understands that in a bear market, it doesn't take much volume for prices to continue their downwards course, but it is volume that drives a bull market. Thus, what is missing from the equation is the realization that in order for the bull to reappear, volume and obviously, dollar trading volume would need to surge back into regions seen only once in history. Our point is that DTV is STILL at mania levels. After all that has transpired, is it a reasonable expectation for volume to surge again? What is remarkable about DTV versus Dollar Trading Volume is that the current mania set a new record despite a difference in the rationale that drove the manias. In the Roaring Twenties, talk of buy and hold for the long term was clearly not the issue, speculating on the present was. Given the circumstance that margins were as low as 10%, the short term was the only game in town. Also, margins this low certainly had to encourage in and out trading like never before. Even so, the current mania is every bit as emphatic. Although the year -end peak for 2000 is lower than the peak in 1929, the add on orange bar shows how high the indicator was at the very peak. The drop off since is far less than after the 1929 pinnacle, an amazing fact when you consider that margins were five times as high in the current era and that the long term was promoted as the end all solution to how to get rich! Yes, we readily admit that the trading game was pushed as well in the current era, but the vast majority of the money in pensions, 401ks and IRAs was not devoted for short term trading whereas in 1929. The longer this measurement remains similarly elevated, the surer we are that the current mania is intact and that the bear market must rage on. A return to the historical average would result in a draw down of roughly 75%. Could a draw down of that dimension be necessary before a new secular bull market can get underway? Given how far this measure fell in the years after the 1929 top, a 75% decline from current levels does not look like very much. The mass hysteria of the mania catalyzed the mass destruction of $7 trillion. But activity is still robust! The mania continues and is still a weapon of mass destruction.
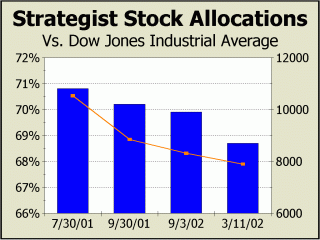
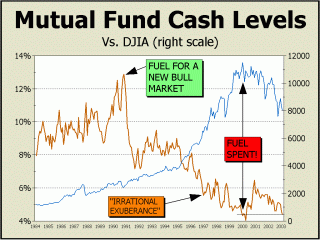
Strategists' allocations to stocks have remained in an extremely tight range for months! Even as share prices continued to fall, the favored allocation found as much sponsorship. If anything, our tallies illustrate a very slight draw down in stock allocations. This in itself is quite astonishing because our stats are taken from the Wall Street Journal's weekly numbers which no longer include several bullish strategists that were subsequently fired. Case in point? Lehman Brother's Jeffrey Applegate, whose 80% stock allocation was second highest on our previous charts. Typically, one would expect stock allocations to fall sharply as stock prices fall. Although prices have fallen a resounding 28% from our first tally, allocations have only been cut by 2%. Now that's either just plain crazy or way too optimistic for one's good. In either case, it appears that most strategists are stuck with their stance and are unable to admit defeat. But there are a few who are realists, like Merrill Lynch's Richard Bernstein, who offers, "Money managers are more concerned with missing the turn than preserving capital." Therein lies the rub. When the Investment Company Institute released their report for January, we were astounded to see that the cash-to-assets ratio for mutual funds had dropped from 4.6% at the end of December to only 4.4% at the end of January. Not only is the current ratio extremely low, it has been lower in only two months since the mania commenced. Those two months were December 1999 and March 2000, just before and right at the very peak in speculative activity and the Nasdaq top. Indeed, the cash ratio was not far from the record low. As we wrote in the March 10th issue of Crosscurrents, "The record December 1972 cash ratio low came right at a major price peak for stocks that was not exceeded for an entire decade and in fact, since that time, the cash ratio has only been lower than now in December 1999 and March 2000, right at the blowoff peak for stock prices in the mania. At this juncture, prices are down substantially and have continued to decline. In the past, when prices declined, managers grew fearful and cash rose. Not now. Absolute cash levels remain on a declining path and are now back to where they were in March 1997, providing less ammunition for any possibility of a renewed bull market. It was one thing back then when folks were just becoming excited about the prospects for tech stocks, the internet and were imbued with the confidence imparted by pie-in-the-sky analyst reports and CEO misrepresentations of income. It is quite another thing now. The actual cash pile may be just as high but the attitudes of investors are not; instead, their attitudes are far removed from the same naive stance as before." With too little in reserve, professionals have left no room for error.
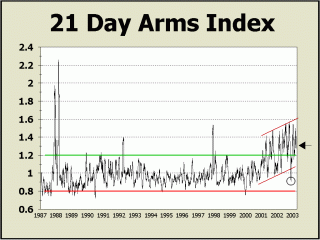
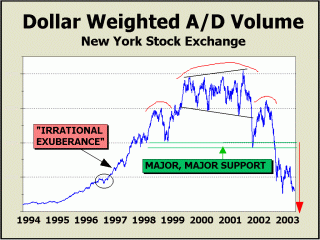
Markets change. They evolve, mutate and although patterns do repeat, the future course can only be judged, rather than proclaimed. Nothing is carved in stone. Traders often venture the aphorism, "As soon as you have the key, they change the lock." For many years, the Arms index devised by Richard Arms, was capable of divining short term tops and bottoms by gauging overbought and oversold conditions. But in recent years, the indicator, also know as the TRIN, has apparently been corrupted by the evolving and mutating markets. This could be due to several factors. Decimalization on the New York Stock Exchange commenced coincidentally about the same time as the Arms index took off without looking back. Decimalization meant a smaller spread between bid and offer, resulting in less unchanged issues. When the NYSE went from 1/8ths to 1/16th changes, the percentage of unchanged issues fell from about 25% of all issues daily to roughly 15%. With decimalization, the number of unchanged issues is now about 5%. Since the smaller spread makes it easier for institutions to "mark up" their merchandise at the end of the day. Without going into all the intracacies of the formulas, we can tell you the effect is to elevate TRIN. But more importantly, the vastly elevated TRIN readings show a market that can accommodate oversold conditions for a long time, longer than we have ever experienced before. There is only one clue we can take from this factor, plus the obvious trend, which illustrates higher and higher readings; the oversold condition is now the "normal" course. However, there is hope for the bulls. The brief dip below 1.00 last November could be the precursor to an eventual return to the good old days. But until the trend changes (and the market morphs once more), oversold conditions must be treated as entirely normal. Last week's breakout to a new cycle high is not encouraging! We believe our Dollar Weighted Cumulative Advance/Decline Volume NYSE measure broke down significantly from an enormous head-and-shoulders pattern put into place over a four year period from 1998 to 2002. The highlighted "Major, Major Support" level provided resistance in late 1997, and then support in 1998 and 2001, both times in which a near panic blew away price supports. When this level was penetrated in 2002, it did so like a hot knife cutting through butter, negating the support as if it had never existed. Our measurement from this breakdown would theoretically take our indicator all the way back to before where our chart begins in 1994! Can this be? Although price is still well above the levels at which Fed Chairman Alan Greenspan pondered the possibility of "irrational exuberance," price is concentrated in too few issues to be the best indication of market action. Out of 7500 issues traded every day, the Dow Industrials are only 30. Of the S&P 500, perhaps 50 account for 90% of the direction of the index. And on Nasdaq, the top 10 stocks are 45% of the top 100, which accounts for probably 90% of Nasdaq's movement. From what we can view of stock market action, there is seemingly no reason to believe a bottom is yet at hand. Last week's breakdown below the October 2002
bottom is
Another cascade is likely to occur.
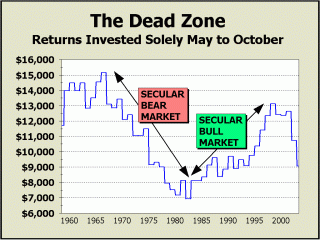
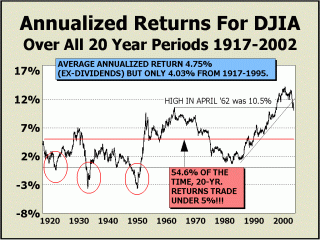
The good six month season is still in effect but the season we have termed the Dead Zone is near enough to focus on today. The Dead Zone encompasses the months from May to October, a period that has spawned dismal results for investors since 1950. Virtually every penny of stock market profits in the last 52 years have been earned during the months from November to April. If one invested $10,000 on November 1, 1950, cashed out at the end of each April and reinvested at the end of each October, one would have run the initial stake into $463,635, an annualized gain of 15.9%. However, the same strategy backfired for the Dead Zone, bringing back a total of $9056, a loss over the 52 year period! As our chart clearly illustrates, the damage was even worse during the last secular bear market from 1966 to 1982. In this 16 year stretch, monies invested solely during the Dead zone period were decimated, losing 54.2%! If the pattern holds, prices could decline another 33% during Dead Zone periods before the secular bear ends. Meanwhile, as evidenced by our opening paragraph, pros are forecasting gains of roughly 20% for the year. During the last secular bear, even the UP Dead zone periods only averaged gains of 4.3%!!! And as it now appears, we will begin the Dead zone period from depressed levels. How anyone can now retain anything more than the most modest positive forecast for the remainder of the year is beyond our comprehension. Twenty year returns (ex-dividends) are all the evidence one needs to dispute the wisdom of buy-and-hold for the long term. If ever there was a definition of the long term, clearly, 20 years should suffice. Our first impression when viewing the rolling 20-year picture is that returns dropped below zero three times. Also, a prominent feature is the climb towards the pinnacle in April 1962, when the 20-year return was 10.5%. It was nearly 35 years before returns were once again as high. And now, after a collapse of such magnitude, bulls are eagerly supplicating the once manic faithful to return to the fold and buy, buy, buy. After all, prices have fallen far enough, no? Actually, no, they haven't. As our chart clearly illustrates, even after all the damage, prices are only nominally below the 1962 peak! If we were to look for a target for the eventual end of this secular bear market, it would not make sense to peg the end at a 20-year return above 5%, since returns under that level have occurred 54% of the time. So, for the sake of the argument, we'll peg the end of the secular bear market at an exact 20-year rolling 5% return. This can be accomplished in different ways; a very rapid drop in price shorter term, a long sideways journey, or a slow deterioration. The short term route to 20-year rolling returns at 5% appears highly unlikely, since the Dow would have to fall to 3324 by the end of October. A slow deterioration over the next three years would still require a drop to 4830! Perhaps the best scenario would be a really long journey out to the beginning of 2010. But even then, the 5% level would not be achieved until the Dow traded down to 7360, considerably lower than today. And then again,
They could be a lot lower. 20-year returns less than 2% have occurred 25% of the time!
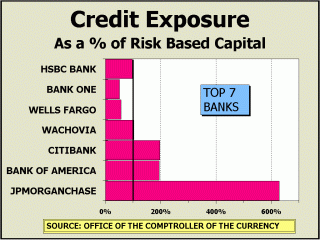
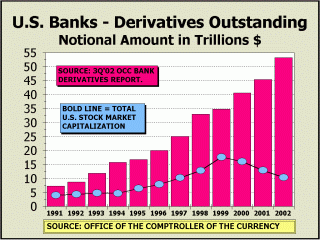
If you haven't done so already, read the Warren Buffett piece on derivatives in this month's Fortune. Those of you who have been with us for any length of time know just how vehement we have been on the dangers of derivatives for several years, covering the subject both here and in our newsletter. [check out our comments in our November 2002 report] Mr. Buffett claims that derivatives are weapons of mass destruction. We believe they are aimed right at the heart of the capitalist system. Buffett's perspective adds plenty of ammunition to the arguments that systemic risks have risen to intolerable levels. For several years, we have been unable to comprehend how our charts imply anything but monstrous risk to the financial system in its entirety. All financial contracts carry some inherent risk and in the case of derivatives, although risk is typically transferred elsewhere, the risk remains very much within the system. Risk is inviolable and cannot be removed from any closed system. Portfolio insurance proved this beyond any shadow of a doubt in 1987, taking us to the brink of a total financial collapse. And if you doubt that Long Term Capital Management was a threat to the entire financial system, picture the need for the nation's largest banks and brokers to meet at the Federal Reserve's office in New York at the "invitation" of the NY Fed President Bill McDonough in October 1998. A similar meeting was never held before nor has been held thereafter. But nothing much has really changed. In the case of JPMorgan/Chase, credit exposure is now equal to 6.2 times their risk based capital. Long Term Capital Management was leveraged far greater in 1998 when it imploded but we can no longer take comfort from academics who insisted it couldn't happen. That it did happen means it will happen again. Notional values covered by derivative contracts are two-thirds more than they were in October 1998. Perhaps the odds are even greater now for another derivative event. We were able to avoid a total collapse in 1987 and in 1998. We may not be as lucky next time. At left below, the top 7 banks dealing in derivative contracts now have exposures that can only be termed fearsome. In the case of Wachovia, Citibank, Bank of America and JPMorgan, these exposures would wipe out all risk based capital. The smallest exposure is suffered by Banc One but is still in excess of half of their risk based capital. What we cannot show in our charts is the daisy chain of counterparties in these contracts. It is probably fair to assume that some of JPMorgan's contracts have one or more of the other banks shown as counterparties. What is not well understood is that in a worst case scenario, if one side of the contract cannot honor its obligations, the other side may suffer losses as well. In fact, derivatives have proliferated to such an extent, we may now fairly assume that all of the largest banks are tied together by a chain of contractual obligations and all are now weighed down by overall systemic risks that can no longer be reasonably measured or estimated. Can the chain function if the weakest link breaks? Long Term Capital Management's demise proved that a break of just one link can cause enough harm to take the system to its limit. Clearly, growth continues unchecked. At bottom right, the bubble in stocks was neatly matched by a bubble in derivative contracts until stock prices peaked. Since then, total notional values of derivative contracts continues to grow and is now more than five times the size of the U.S. stock market. From $7.3 trillion in notional values in the fourth quarter of 1991 to $53.2 trillion in the third quarter of 2002, derivative growth has been incredibly rapid. An equivalent price increase in the Dow would have taken the Industrials to 23,093 last year! Can this rapid pace of growth be maintained without another "accident" like those suffered in 1987 and 1998? At this point, we are fearful that no one comprehends the magnitude of how the parties and counterparties interact and intertwine. No one can determine the depth or intensity of the manifold risks. Should the worst case arise again, there are no guarantees a solution can or will be found in time. And unlike most of the weapons of mass destruction
the world must endure,
the fuse is always lit.
This week's turnaround from two solid months of deterioration has been cheered as the start of yet another cyclical bull market, the fourth such "start" since the first proclamation after the September 2001 bottom. We have no doubt that stocks are due for a rally in any event, but we doubt the prospects can be anywhere near what bulls trust they are. Simply put, every single reason that we might put forth for the continuation of the bear market can probably stand on its own as reason enough for the bear to endure. Most importantly, bear in mind that the derivative
shocks felt in 1987 and 1998 were unwound only with concerted efforts that
came in the eleventh hour, too close to a financial meltdown for us to
take any comfort that we will be similarly blessed if another meltdown
threatens in the future.
"The derivatives genie is now well out of the bottle, and these instruments will almost certainly multiply in variety and number until some event makes their toxicity clear..... Central banks and governments have so far found no effective way to control, or even monitor, the risks posed by these contracts.... "[they] are financial weapons of mass destruction, carrying dangers that, while now latent, are potentially lethal."
Our adjusted forecast
for 2003 places the highs for the year at:
Our forecast for 2003
places the lows for the year at:
THE CONTENTS OF THE ENTIRE WEBSITE ARE COPYRIGHT 2003 ALAN M. NEWMAN Alan M. Newman, March 15, 2003 All information on this website is prepared from data obtained from sources believed reliable, but not guaranteed by us, and is not considered to be all inclusive. Any stocks, sectors or indexes mentioned on this page are not to be construed as buy, sell, hold or short recommendations. This report is for informational and entertainment purposes only. Longboat Global Advisors, Alan M. Newman and or a member of Mr. Newmanís family may be long or short the securities or related options or other derivative securities mentioned in this report. Our perspectives are subject to change without notice. We assume no responsibility or liability for the information contained in this report. No investment or trading advice whatsoever is implied by our commentary, coverage or charts. |
