|
CHART DATA AS OF MARCH 3, 2002 A SPECIAL REPORT BY ALAN M. NEWMAN, EDITOR LONGBOAT GLOBAL ADVISORS CROSSCURRENTS |
| The most disheartening factors
concerning the end of the stock market mania have been the many recent
confirmations that the mania was just not possible without concerted efforts
by key participants to coerce small investors by any means possible, including
malfeasance, conflicts of interest and even outright frauds. As in
the South Sea Bubble and other manias, a repeat of history. We maintain
our position that Enron represents a watershed event, the only possible
"new paradigm" that could have come out of the insanity that drove prices
to levels that discounted impossible rates of economic and corporate growth.
The
new paradigm and new economy that professionals touted never was.
And as we have shown in our newsletter commentary and charts in recent
months and show again a few paragraphs below, investors have not benefited
from participating in the mania. Question: who did benefit?
Answer: the large Wall Street firms that pushed high flying stocks and
initial public offerings at prices that defied reason, the analysts who
parlayed their supposed skills into investment banking relationships that
presented the worst conflicts of interest, and especially the insiders
of some publicly traded companies that abandoned fair play in the quest
to engineer earnings in order sell their own inflated shares acquired via
options. The inside truth is that insiders have been selling shares
at a pace that eclipses their purchases by a factor of more than 100!
This mania can only end the way all prior manias have ended - with public distrust of the very professionals that coerced them into the madness the first place. Human nature is what it is and allows history to repeat.
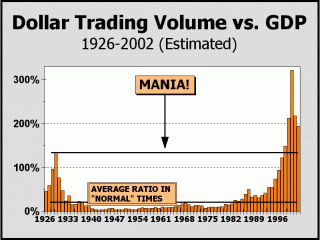
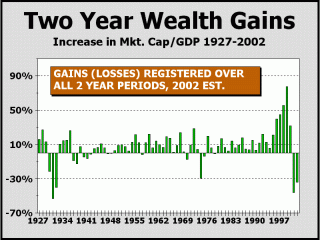
We are still awaiting the final GDP figures for the 4th quarter of 2001, but our latest estimate for Dollar Trading Volume represents a rather sharp drawdown from the peak of 322.4% in 2000. Our best judgment is that 2001 ended with DTV at "only" 218.1%. As a reminder, even in the insanity of 1929, DTV was substantially lower, at 133%. Does this mean the mania is totally at an end? Given the crisis in confidence, it certainly appears that the mania has been mortally wounded. However, we must still bear in mind that even our initial estimate for 2002 finds investors trading $1.95 for every dollar generated in GDP. Thus, stocks are still the most important facet of the economy and because they are, the crisis in confidence is far more important than the financial industry believes and the crisis has the power to completely unwind investor trust, much as it did after the debacle in 1929. Reality represents an assault of sobriety and reality is only slowly setting in. Two year wealth losses continue to be highly significant and are second only to the massive losses incurred after the 1929 crash. Clearly, wealth losses were at least partially responsible for the economic depression that followed in the early-1930's. That current wealth losses are not a major consideration in the prognostications of economists and strategists is likely a manifestation of complacency at best and utter ignorance at worst. Total stock market capitalization has declined by at least $5 trillion since the March 2000 peak and represents nearly half the country's GDP. It was not until 1932 that losses were worse than they are now. The inside truth is that the financial industry does not want you to know and continues to cheer on the long term mantra. We are somewhat encouraged by our present economic resilience and believe that a similar worst case scenario to the 1930's will not necessarily play out, nevertheless, we see every reason why the damage done to wealth and confidence will lead to a protracted and deep secular bear market at the very least. The wealth already lost will likely remain lost for at least several years to come.
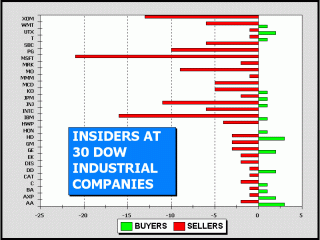
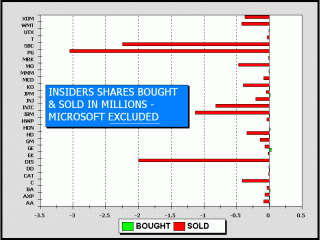
Much of the following commentary appeared in prior issues of Crosscurrents. We feel it is important for us to reiterate these views and disseminate this article as widely as possible. We were shocked while sauntering through the S&P Marketguide database, when we discovered a group of ten passably representative high tech companies that witnessed huge insider sales. The group included Microsoft, Intel, Cisco, IBM, Hewlett-Packard, EMC, Amazon, Sun Microsystems, Dell and Yahoo. There were 87 sellers and only 3 buyers. Sort of spoke volumes about the lack of fair valuations, we thought. But we wondered whether we might just have hit a dry zone for insider enthusiasm and perhaps we shouldn't have just focused on high tech or sampled so few companies. So we consulted our database and performed a similar exercise for all the 30 Dow Industrial companies and what we found was truly astounding. Hold on to your hats. The most bullish perspective we can provide is that there were buyers at 15 companies and sellers at 28. Only two companies had no sellers, Int'l. Paper and Honeywell, but IP had no insider trades at all (hence we removed them from the charts) and there was only one buyer at HON. There were 23 buys overall and 141 sales for a 6.13 sell/buy ratio, as shown at left below and as huge a gap between the two as we have ever witnessed. But it gets worse! The average buy transaction took in 3870 shares while the average sale dumped 241,057 shares, a ratio of 62.3-1. It gets still worse! A grand total of 89,000 shares were purchased versus a grand total of 33,989,000 sold, a ratio of 381.9 shares sold to each share purchased! We're not inclined to dispute the S&P Marketguide numbers. The ratio of shares sold to shares purchased is the most horrendous we could have imagined and clearly illustrates that insiders - who are as acquainted with the current environs as anyone - are abandoning their ownership at record speed. But then again, we mused, perhaps this display of revulsion by insiders towards their own shares might be influenced mightily by the honchos at Microsoft. As previously revealed in Crosscurrents, Microsoft insiders made zero buys, 21 sales and 21.46 million shares were dumped, presumably many by Bill Gates. Thus, we feel duty bound to present the Dow numbers minus the one-sided influence at Microsoft. The tally: 23 buys, 120 sells for a 5.22 sell/buy ratio, still the worst we have ever seen. Average buy; 3870 shares, average sale; 104,450 shares. And as shown at right below, total shares purchased 89,000, total shares sold 12,534,000. Sans Microsoft, 140.8 shares were sold for each share purchased. The Inside Truth:
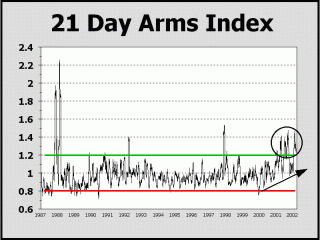
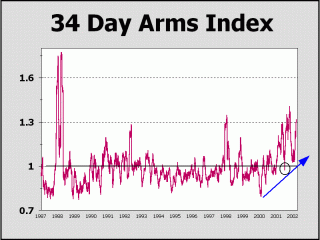
One of the principal reasons a bear market such as the one we expect can unfold is that the majority of participants are utterly fooled into believing it cannot happen. Just as delusions prevailed at the very peak in March of 2000, delusions will prevail at the peak of the corrective rally. The TRading INdex (TRIN), invented by Richard Arms, has been throwing off the most bullish signals ever seen for many months. Many players, including technicians of every stripe, seem to be focused so heavily on this one indicator that we wonder if they can see the forest for the trees. Clearly, in prior times when the 21-day indicator exceeded a very "oversold" 1.2, it was not long before the bull resurfaced and strongly, at that. As well, with the exception of what the crash of 1987 wrought, the indicator never remained above 1.2 for any appreciable length of time. Typically, an oversold market is reversed rapidly. But in the present circumstance, the indicator appears to be radically different from before. First, note the inclined pattern of low readings maintained since the beginning of 2000. We would also note that decimalization commenced at precisely the same time. Is the effect of higher readings due to decimalization? Or perhaps our very astute colleague Chris Carolan (www.calendarresearch.com) is correct in assuming that the great number of interest rate sensitive issues (45%) on the New York Stock Exchange have been responsible. These issues typically trade on small volume and have been able to impact the TRIN dramatically. Clearly, there is an effect and it has kept the indicator above the 1.2 extremely bullish trigger point an amazing 48.7% of the time since the March 2001 peak! Despite continuing high readings, the bull has not returned. The 34-day incarnation of the same indicator displays equal bullishness for those who do not wish to analyze what is actually at work here. The preponderance of bullish readings above 1.2 have still not resulted in the takeoff anticipated by bulls and can only be a result of a dramatic change in the indicator itself. Given that a reading of 1 represents a perfectly balanced and normal market, it is somewhat staggering to realize that the 34-day indicator has been below 1 on only two days (circled area) since January 1, 2001! Continuing high readings are proof that the character of the market has changed. The Inside Truth:
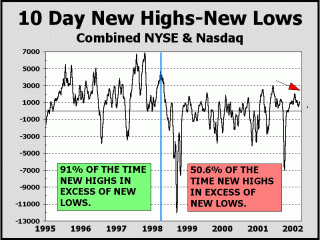
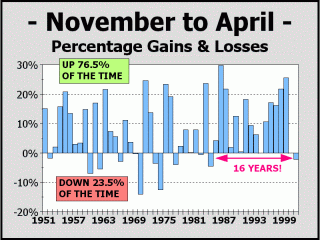
Many technical indicators have been in typically bullish territory for months. The Advance/Decline line and New Highs are amongst the many indicators like the Arms Index, that appear to be signaling an all clear. But these are not typical times! And just as the mania produced convoluted rationales and allowed investors to buy into the most egregiously overvalued market of all time, the end of the mania must produce ways to fool investors into believing all is at least, well. As our 10-day New High/New Low indicator clearly illustrates, there are two totally different markets, one up to early 1998, and the one thereafter. We have shown many times before how the peak in the broad market occurred anywhere between October 1997 and April 1998, depending upon which indicator we looked at. The picture at left below is further proof. And despite an enormous rally from the September 2001 lows, New Highs minus New Lows has still provided a lower low than in 2001 and is again, pointing down. We would also point out that the bottom in 2001, which was due at aggravating circumstance, never provided the type of oversold climax as was visible in October of 1998. The inside truth is that New High and New Lows are nowhere near as bullish as they were a few years ago. Another move to at least the levels of September 2001 could easily be in the cards. Bulls have been hanging onto all kinds of historical factors, including the seasonal tendency for stocks to gain ground during the months of November through April. We have discussed this phenomenon in detail on several occasions and months ago alluded to the conclusion that the current "favorable" period need not turn out well. The period has been down in two consecutive years only once, in 1973-1974, and bulls are arguing that one down period is sufficient. We demur. Although down November-April periods only occur roughly one-quarter of the time, there were sixteen consecutive years of up performance. Given history, the odds of such a string is 73-1 (less than 1.4%). There is no reason why a repeat down performance cannot be in store again for the six months ending April 2002. Also, last year's "dip" was below average at minus 2.2%. The average for the 12 down periods has been minus 4.9%, which would imply Dow 8630. In our view, the implied Dow 8630 "target" is eminently doable.
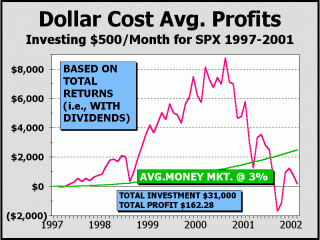
At left below, you see a view that has only been seen in Crosscurrents (January 22, 2002) and nowhere else. As always, we strive to present the most original and powerful research and commentary. The chart illustrates how dollar cost average investment in the S&P 500 has performed over the last five years and two months including dividends, a view that Wall Street has endeavored to keep you from seeing. Incredibly, an account utilizing everyone's favorite strategy was actually in the loss column after 58 months and yielded a paltry 1.7% compounded (monthly basis), even under performing the money markets over five years. After the full 62 months shown (through February '02), total profits came to only $162.28 on $31,000 invested! Although our comparision uses average money market yields of 3% going back to 1997, in reality, even cash at 1% turned out to be king! Given the better part of the mania for stocks, one would be excused for believing the results for stocks might have been a lot better. The buy-and-hold mantra was and is clearly a myth perpetrated by ignorance. As we see here, the money market investment comparison made 62 months ago at Dow 6448 has outperformed stocks by so much to date that Wall Street's insistence upon the long term mantra is truly laughable. After 62 months, the meager profits of $162 for Dollar cost Averaging (as of 2/27/02) prove that the common wisdom is worthless. Wall Street has pushed Dollar Cost Averaging for years as a sure fire method of acquiring wealth, citing the logic of buying more shares at low prices as a mathematically valid proposition. We agree in theory. However, in practice, the only methodology that works is reason. If prices are too high, stocks should be sold and not bought. The proof is in the pudding. The Inside Truth:
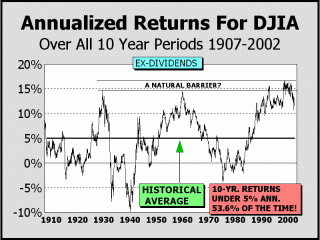
Given the history of an entire century, prices are still too high! Ten year annualized returns for the Dow Industrials are still hovering above 12%, far removed from the historical norm of 5%. Could the huge increase in returns signify the vaunted new era? The huge increase in returns certainly prodded similar thoughts in the 1920s and 1960s, yet both those eras witness regressions to reality and the norm. If anything, the current era stretched further in price and time than at anytime before and may need to be unwound in similar fashion - a deep and protracted secular bear market. The returns we show are without dividends, which have averaged over 4% over time. Thus the true return for stocks is roughly 9%. However, even when you consider that dividends throughout the mania have been extremely low, returns have still far exceeded the average. We expect that returns ex-dividends will drop sharply and that corporations will be forced to raise dividends as a result, to keep shareholders content. So, in both regards, we expect a regression to the norm. Clearly, returns ex-dividends have been under 5% more than half of all ten year periods and a similar retracement at this juncture would be a totally normal outcome. This, of course, might take years to unfold and the regression can occur in either price or time. For instance, if the Dow were to remain mired at the 10000 mark, the regression would be achieved in November 2006. If the Dow were to decline modestly over time to 8000, the regression would be reached by December 2005. If instead, the Dow declined to the 6437 level at which Alan Greenspan first suggested "irrational exuberance," it would only take until February 2005 for a return to "normal." Since the prior two huge bear markets resulted in returns below 0%, prices could indeed go a lot lower and the bear could extend a lot further out in time. As far as we are concerned,
Investors have learned a harsh lesson in the mania. The watershed events of Enron and Global Crossing represent patent proof that the public's protection from harm is minimal. We are to believe that both Kenneth Lay and Jeffrey Skilling, the Chairman and CEO of Enron knew nothing of what was coming down the pike? If they were that ignorant, how could they be in such responsible positions to begin with? Instead we are to believe there was a "run on the bank?" We believe there was a run on the truth. By its very definition, a mania is a time of widespread hysteria and faulty rationales. However, in order to believe, investors have to be convinced that there is a rational basis to their actions. This can only occur when certain participants are able to devise untruths and cajole the public. A mania is a time of time of deceptions. Clearly, the larger firm analyst community were impotent when the time came for reality to surface. Even now, sell recommendations are for the most part, anathema. Clearly, several investment firms themselves parlayed their analyst relationships into lucrative investment banking deals regardless of how silly the prices of their "product" might be. Clearly, the insiders of several high-flying companies that engineered an apparent growth, did so while carefully and willfully disguising inferior results. But the most conclusive proof that valuations remain stratospheric is patently evident in the actions of insiders who have been selling their own shares at rates that belie the stated bullish outlooks for their own companies. And even now, as journalists have the opportunity to tackle the truth and expose it for the public good, BARRON'S has elected to show S&P 500 "operating earnings" instead of the "as reported" earnings they have shown for years, resulting in a apparently favorable decline in the S&P's P/E multiple from an obscene 44 to a still high, but far more reasonable 28. We believe BARRON'S is doing investors a terrible disservice by publishing "operating earnings" rather than the "as reported" earnings they have shown for generations. And although we believe they are only reporting the numbers handed to them by S&P, we guess this is only another unsurprising development in an environment beset by confusion, befuddlement and misconceptions..... The Inside Truth:
If you wish to contact BARRON'S to protest their use of "operating earnings." instead of "as reported," please copy the following text or write your own letter to the Editors. To the Editors of Barron's: I am writing to protest your use of "operating earnings" instead of "as reported" earnings for the S&P, the numbers you have previously reported for decades. Using the "operating earnings" method makes things look far better than they really are and can only serve to confuse and mislead investors. The truth is more important and the truth is that writeoffs of one kind or another appear year after year after year enabling "operating earnings" to far exceed earnings "as reported." Your move to show only "operating earnings" is a luxury we cannot afford at the end of a veritable stock market mania. We need to be able to trust that Barron's is wholeheartedly in the corner of investors.A small portion of the charts and analysis presented here are shown in our newsletter weeks and months in advance of their appearance on this site. If you haven't already, we urge you to take advantage of our FREE 3-issue trial (see link below). We hit our targets for both 2000 and for 2001. Two updates ago, we said "The September 21st low was very likely the low for the year....we believe the SPX could trade as high as 1249 (1177 much more likely) before the end of the year." We pretty much nailed the top print which came in at SPX 1173.62 on December 5th and actually called for a December 6th high in our newsletter. As it turns out, the high since the September low has been 1176.97 registered on January 7th, only .03 from the "much more likely" high we had initially pegged. Our initial downside targets for 2002 have been altered from our last update only for the S&P 500 and Nasdaq; upside possibilities remain the same. Our downside targets
for 2002 are as follows (2 in 3 odds):
Our best case scenario
for 2002 is as follows (low probability):
Alan M. Newman, March 3, 2002 All information on this website is prepared from data obtained from sources believed reliable, but not guaranteed by us, and is not considered to be all inclusive. Any stocks, sectors or indexes mentioned on this page are not to be construed as buy, sell, hold or short recommendations. This report is for informational and entertainment purposes only. Longboat Global Advisors, Alan M. Newman and or a member of Mr. Newmanís family may be long or short the securities or related options or other derivative securities mentioned in this report. Our perspectives are subject to change without notice. We assume no responsibility or liability for the information contained in this report. No investment or trading advice whatsoever is implied by our commentary, coverage or charts. |
