|
- THE GREATEST STOCK MARKET MANIA
OF ALL TIME -
DATED JUNE 29, 2009 A SPECIAL REPORT BY ALAN M. NEWMAN, EDITOR CROSSCURRENTS This feature is now published on roughly a quarterly basis. Our next update will likely be published by mid-October 2009. |
|
Our readership
continues to grow.
This report
is primarily a compilation of articles that have previously appeared in
the Crosscurrents newsletter.
Please check out the testimonials on our Kudos page. Printable
files of this report are available only to paid subscribers. If you
are interested, please CLICK
HERE
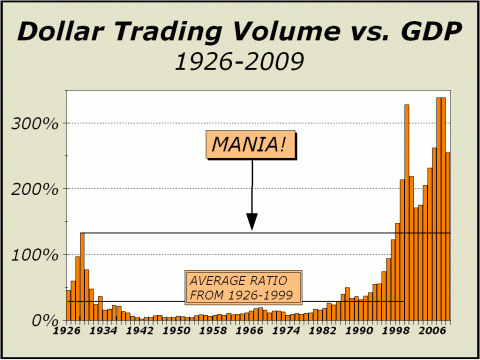
The two most recent issues of Pictures of Stock Market Mania featured previous Crosscurrents articles on gold and derivatives. In the interest of presenting as many perspectives as possible, we will not cover these subjects again until later in the year, one of which we expect to present in our next issue to be published in October. As you probably know by now, this feature is now published for free roughly every three months to an ever-widening audience. If you are interested in seeing our articles earlier or wish to see more of our work, there are links to additional samples, a free trial to the Crosscurrents newsletter and subscription links elsewhere on this website. Our lead charts for years have focused on total Dollar Trading Volume, which we believe was the first indicator to clearly and accurately present the case for a veritable stock market mania in progress. But much has changed in the last decade. The American Stock Exchange has now been absorbed by the New York Stock Exchange, which also trades Nasdaq issues. There are various electronic exchanges, and data is difficult to come by and collate. Also, much of today's transactions are in Exchange Traded Funds (ETFs), rather than individual stocks, and as a result, fair comparisons to previous years are becoming increasingly difficult. Program trading is once again on the rise and now accounts for approximately 30% of all volume. So-called "dark pools of liquidity" account for 9% of trading. These transactions are "dark" since they do not even publish bids or offers for the public's edification. This is not your Father's stock market anymore. Nothing is as it appears, as much the reason for the worst bear market in decades as any other reason we might muster. At least a year ago, we admitted that the data for our lead charts were becoming increasingly difficult to rely on. That said, we also claimed our charts were likely off by no more than 2% from actual activity. We can no longer make that assumption. Simply put, we cannot guarantee that we will be able to reliably construct the dollar trading volume charts from available data in the future. However, we believe this issue's charts present a fairly accurate approximation of activity in the U.S. stock market.
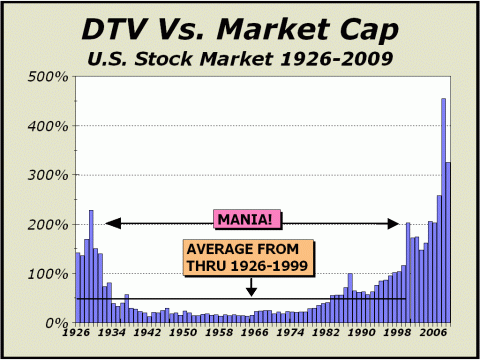
In our last issue, we commented that we were "constantly amazed by the statistics," and our focus has typically resided on the excesses of the mania and previous periods of stupendous one-sided sentiment for stocks. After all, total Dollar Trading Volume (DTV) didn't just expand, it exploded 28-fold in a 20 year stretch from 1988 to 2008, an annualized average rate of gain of more than 18%. As crazy as that statistic might sound, it doesn't fully describe the extent of the mania, since in the 20 years leading to the manic 2000 peak in prices, DTV advanced by an average of 23.4% per year! However, it is about time we focused on the opposite side of the equation; the bear market bottoms that inevitably follow the manic peaks. The stats may be every bit as relevant and may offer clues to when we may expect a solid and long lasting upside reversal in prices. Thus far, the rally from the March bottom has been impressive but three or four months is not a long term trend. As prices surged into the 1929 manic peak and subsequently crashed, $125 billion in stock changed hands, equivalent to 133% of GDP and 228% of market capitalization. By 1932, when prices had collapsed by nearly 90%, DTV sank to 23.7% of GDP and 73.1% of market capitalization, both spectacular declines. Only $13.4 billion changed hands in the entire year of 1932, an amount now typically traded in only 36 minutes. Although there might be some controversy about labeling the 1966-1972 era as a mania, there was a tremendous resurgence of interest in stocks both large and small as the Dow approached and finally exceeded the 1000 mark for the first time in February 1966. By 1972, mutual funds had taken the spotlight and concentrated their sponsorship on a small segment of the market, fifty rapidly growing companies commonly known as the "Nifty Fifty." Clearly, this was not the same type of lunacy that swept the public into margin-related purchases in 1929, but an institutional mania that was nevertheless profoundly guilty of one-sided sentiment. DTV nearly tripled in only 11 years and peaked at 19.2% of GDP in 1968 only to fall dramatically to 7.8% of GDP in 1974. In the current era, DTV reached 328% of GDP in 2000 and fell to 171% in 2002, then rebounded to 339% last year and has subsequently declined to 255% of GDP. Compared to either the public led lunacy
of the roaring Twenties or the institutional led lunacy of the 1970s,
We doubt that a replay of the Roaring Twenties is in progress, thus any expectation of a collapse of DTV to anywhere near the all time lows is nil. As our chart above illustrates, DTV averaged roughly 29% of GDP from 1926 to 1999. The average over the entire 83 year period shown is 55%. Even that average seems unreachable, if only for the reason that mechanical trading methodologies continue to be so prevalent. Program trading has recently accounted for close to 31% of all NYSE volume and the trend in programmed trades appears to be rising. As you can see below, despite the halving of the major averages from 2000-2002 and then again from 2007 to 2009, DTV versus total U.S. stock market capitalization remains very much on an upwards path. While the public has certainly pulled back from the arena, sophisticated technologies and methodologies continue to proliferate and dominate the arena. For all intents and purposes, the individual investor has become an endangered species.
There is every reason to believe that a contraction to the same levels suffered in 2002 is achievable. At that time, DTV fell to little more than 170% of GDP. If the same circumstance occurred
today,
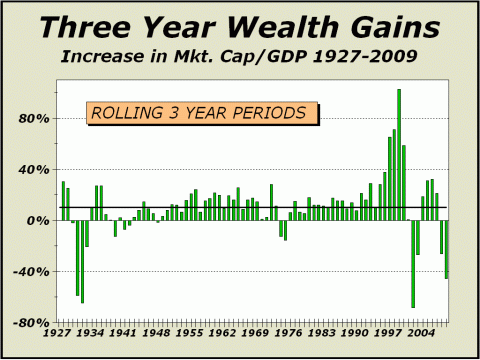
The resulting contraction would likely translate to a second capitulation phase for the secular bear market, an event we believe would have the potential to end the secular bear market. Three year wealth gains (losses) imply there is more downside in store. Note how the huge plunge in wealth after the 1929 crash impacted investors several years later. There were five positive years from 1934 to 1938 and then another series of poor years. The similarities to the current phase are striking. However, the second series of negative readings in the current phase measured from 2000 are far worse than what occurred before and as a result, we have reason to believe investors do not yet possess the courage to turn the market around. Too much wealth has disappeared.
Individual investors have become an endangered species.
The following article was the
lead article in our May 11, 2009 issue.
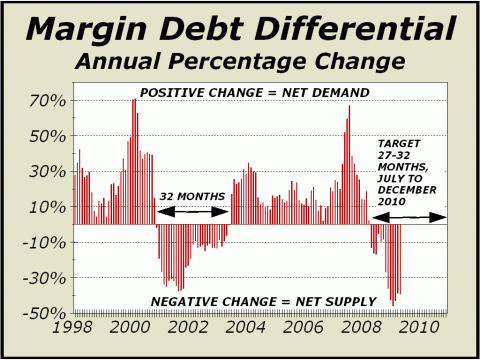
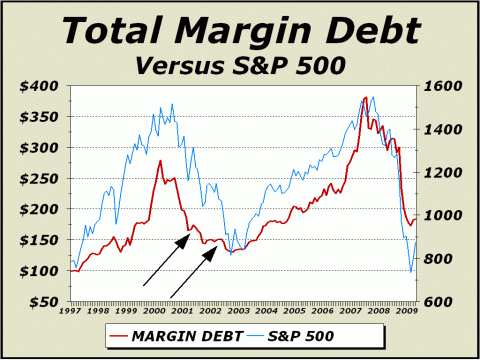
Bear Market Still Threatens Until Late 2010 Mixed measures continue to proliferate, both offering hope for bulls and sustenance for bears. While there appears to be good reason for believing prices have bottomed, with perhaps only a solid retest of the March lows as a necessary component of the bear market, history strongly suggests far more time will be required before a new bull market can commence. Our featured chart illustrates the one year differential in total margin debt as tallied by NYSE and NASD firms. Margin debt at NASD firms is only a fraction of what we typically see at NYSE firms, but there seems no point in ignoring any contribution to the overall problem of an over leveraged market. As well, the NASD’s share of total margin debt has grown larger in recent years. While margin debt at NASD firms was only 7.1% of total margin debt in March 2000, the NASD’s share was as high as 15.9% in October 2008.
The good news is that total margin debt has dropped dramatically and rapidly from the July 2007 highs, shortly before prices peaked. Thus, we can reasonably infer that much of the speculative excess that catalyzed the price collapse has been removed from view. After all, the post-mania collapse from 2000-2002 was one of the most significant declines in stock market history and as the chart clearly illustrates, the current annual contraction in margin extends beyond than that of the mania’s dénouement. As of January 2009, margin was down 46% over the preceding 12 months. The bad news is that a horrific downside such as the present collapse should not be expected to reverse before all traces of speculation are removed from view. In the aftermath of the original mania, the annualized rate of change in total margin debt did not dip below zero until November 2000, eight months after the price peak. The rate of change did not bottom until August 2001, 20 months after the price peak and the rate of change did not forge above the zero line again until June 2003, 32 months after the peak and only three months after a significant test of the bear market bottom in March 2003. Margin debt declined for 31 consecutive months on an annualized basis. In the current bear market, the annual rate of change did not pass below zero until April 2008, six months after prices peaked. Thus far the rate of change for January 2009 represents the worst case, 15 months after the top. A simple extrapolation leads us to believe that the rate of change will not rise above the zero line again until 27-32 months after the measure first fell below the zero mark. That would take us into the period from July to December 2010. Bear in mind that a rate of change below zero equates to net supply and that a rate of change above zero equates to net demand. Interestingly, we have already gone on record that a number of factors point to an end of the bear market in October 2010 and we have even mentioned October 23, 2010 as a specific target. Given this issue’s analysis of margin debt, we see yet another reason for the existence of our target time frame. Clearly, as our chart below illustrates, stock prices are not likely to go up for any serious length of time before and unless margin debt is once again on the rise.
Thus far, the lowest margin debt reading occurred in February 2009, down 52% from the June 2007 peak. Margin debt declined 55% from the mania’s peak into the 2002 bear market low. Q: Is this similar decline in margin debt sufficient to mark the bottom? A: Given the extent of the collapse in the economy, it is likely that margin debt will continue to contract until there is visible evidence that the economy is ready to turn. Despite the little blip of a reversal in the month of March, our two arrows point to similar respites in which margin debt briefly rose during prior bear market rallies. As well, the level of margin stabilized from October 2001 to May of 2002 before once again turning down to the bear market bottom. There is still good reason to believe that the current contraction in margin debt will eventually approach the levels of September 2002 before the next bull market can begin. If we are correct, margin debt could contract by as much as one-third from today. Net demand, as shown by our front page chart, is likely well over a year away. Best bet; Autumn 2010.
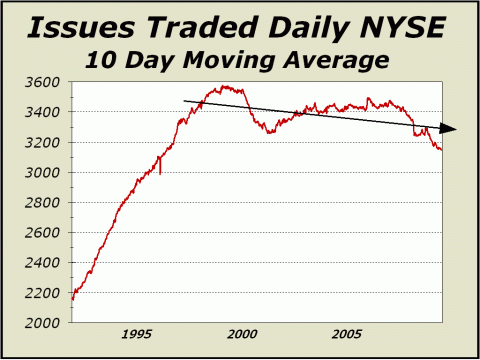
Below, also reprinted from the May 11, 2009 issue of Crosscurrents. A Bull Market Requires Stocks The chart below highlights just how incredible the metamorphosis of the U.S. stock market has been for investors! Less stocks trade but more ETFs trade. In our view, it is no mere coincidence that the peak in traded issues occurred during the mania for stocks and no mere coincidence that the tremendous growth exhibited for ETFs occurred as the public’s interest in risk slid alongside prices. It’s been all about product and many ETFs have been touted as all-purpose vehicles for investors. However, it should be obvious that a bull market requires value to discover in individual issues. The number of issues traded on the NYSE rose during most of the secular bull market and has declined during much of the secular bear market. We would expect this indicator to once again be trending up before the bear market concludes.
Could we present a clearer picture of "endangered species?"
And again below, our feature article reprinted from the May 11, 2009 issue of Crosscurrents. Endangered Species A recent Bloomberg interview (http://tinyurl.com/dhawxr) highlighted the horribly broken nature of the U.S. stock market's mechanics, specifically the facility with which naked short sales still exist. The discussion between Former SEC Commissioner Roel Campos and short selling activist Manuel Asensio took on the matters of the uptick rule and naked short sales. Mr. Campos seemed lukewarm at best about a reinstatement of the uptick rule and called it a bit of "chicken soup," which we guess means all it will do is make folks feel a bit better, while not really accomplishing much. While we believe that ANY move to foster confidence in the U.S. stock market must be correct, we also must admit that in today’s environment, it is exceedingly simple for the uptick rule to be circumvented, which of course, negates most, if any benefit. The truth for investors is that the playing field has been tilted again them for years and the arena exists not for the benefit of the public, but for the benefit of the institutions that can take advantage of investors. Mr. Asensio, on the other hand, not only called for elimination of any uptick restraint but also came down hard on the side of no borrow requirements at all to short stock, claiming, "Any requirement to borrow stock before you sell it is a negative for short selling. The whole concept of the existence of naked short selling is an absurdity. There should be no reason to borrow stock. One should be able to sell stock at will." The Bloomberg piece seems no more than the same old story of a slavish and compliant SEC doing the bidding of its Wall St. masters with zero recognition of the harm done to our financial markets and a hedge fund activist who believes that the capital formation system should have absolutely no foundation nor structure. Folks, this is truly bizarre. It is pathetic that the mainstream media have been so ignorant of the mechanics of the system and the harm generated by same and it is pitiful that we have come to this point as the system has been pillaged at the public's expense. Simply put, our financial markets can only endure if those securities issued, listed and purchased by investors are genuine. However, Asensio's views take us into a fantasy land where a virtually unlimited number of shares can be shorted. May we remind you that on the other side of each and every short sale, there MUST be a buyer. Even if you sell short what you do not own or borrow, someone is buying the shares that you sell. In the case of General Electric (GE), the company has authorized the issuance of 10.6 billion shares. Somehow, large block owners own 11.9 billion shares, 12.3% more than are authorized to trade. Where did the extra shares come from? Short sales. In the case of IBM, the company has authorized the issuance of 1.3 billion shares. Somehow, large block owners own 1.6 billion shares, 23% more. Where did the extra shares come from? Short sales. Bear in mind, we are not counting any of the shares that might be held by individuals not counted as “large block owners.” For kicks, we did a Google search for "most heavily shorted stocks" and amongst the 52 million results found a list of ten stocks from 2003 (http://tinyurl.com/dl3huf). Did we say 52 million results?! Indeed, we did. Several of the group are now extinct but the ones still extant are typically so incredibly over owned even today that we can only wonder how anyone can trust the stock market. Take Cheesecake Factory (CAKE) and Molex Corp. (MOLX) for instance, each of which have at least 60% more stock owned by large block owners than the companies have issued. These are not small fly-by-night companies; CAKE has sales of $1.6 billion and MOLX has sales of $3.2 billion. But we went another step further and then searched for “highest percentage of float short” and came up with equally disturbing results, pulling in a Bespoke Research study from September 28, 2008. We only checked ten of the 25 listed stocks, enough to further fortify our determination that the markets are broken. For each, large block owners alone accounted for well over 100% of the total of authorized share issuance. The companies included Web MD (WBMD), Sears Holding (SHLD), Cree Inc. (CREE) and Mylan Labs (MYL). Five companies had large block owners of more than DOUBLE the authorized shares issued. The five included Lennar (LEN), Martin Marietta (MLM), Big Lots Ohio (BIG), Chipotle Mexican Grill (CMG) and Panera Bread (PNRA). All have revenues well in excess of $1 billion. The worst offense to shareholders was PNRA, which has 29.5 million shares outstanding but somehow has large block owners of 69.5 million shares. Recently, we communicated with one very prominent long time observer of the markets recently, who admitted being involved in circumvention of the uptick rule. When specifically asked “Isn't the facilitation of hedge funds you described clearly a gaming of the system?”, our correspondent promptly answered, “Of course, that’s what Wall Street does – game the system.” We do not make this stuff up. The short sale mechanics of the U.S. stock market are horribly broken. Investors are well advised not to trust anything they hear and only half of what they see.
Most unfortunately, the agency responsible for keeping track of stock ownership is fighting to do away with paper certificates, the only way one can currently certify ownership without any doubt as to legitimacy. Given the statistics we have presented in past months, a brokerage account entry proves nothing. Our poster child company Blue Nile (NILE) has 14.5 million shares authorized to trade, yet 38.2 million shares reside in brokerage accounts. Transfer Agent Lori Livingston was so alarmed about the DTCC’s moves towards paperless “ownership” that she wrote the SEC to question their operations, pleading that “it has become more and more difficult to determine who owns the shares, who is trading them and if the trading is proper.” You can read her letter at http://tinyurl.com/dbtlsh. The DTC has termed the move to paperless ownership “dematerialization.” For all intents and purposes, this is a perfect description of what is to come and amply defines a sad future for investors. Note: NASD has previously sanctioned Asensio for matters involving short selling activities and he was later barred "from association with any NASD member in any capacity."
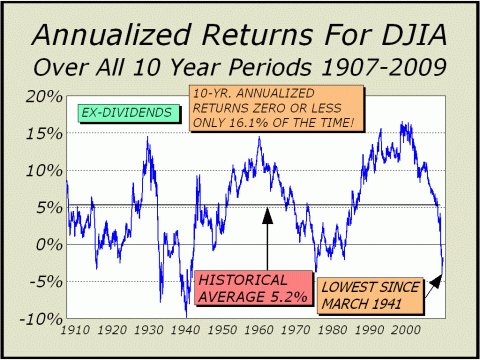
The Long Term May Finally Portend Well The conventional wisdom that stocks are one decision investments - buy - has been totally crushed. We have shown the perspective below many times in the last few years, always insisting that the conventional wisdom was wrong and that history showed resounding potential for another horrible bear market, as in the 1930s and the 1970s. Clearly, we were correct. We have repeatedly attempted to show how individual investors were rapidly becoming an endangered species, through their own actions and also as a result of a complete transformation of the U.S. stock markets, a process we referred to as a metamorphosis (see http://www.cross-currents.net/archives/dec03.htm).
10-year annualized returns fell to their lowest level since March 1941. The good news is that these returns have probably reached their nadir. We do not expect this indicator to worsen. The bad news is that individual
investors
To see a free sample copy of the Crosscurrents newsletter, CLICK HERE
In the last issue, we placed upside potential for the Dow at 9000-9100, SPX 940 and Nasdaq 1665. The Dow and S&P have yet to reach these levels but Nasdaq has traded as high as 1862. Our Speculative Intensity indicator for Nasdaq has soared to its highest upside trend reading since the mania peaked in 2000, in our view, a significant signal. We also estimated downside risk to Dow 6400 (the March lows), SPX 660 and Nasdaq Composite 1200. We have adjusted these levels slightly. We also said "Volatility should decline slowly over the next five months. The reward/risk ratio is now temporarily positive for stocks" and were completely correct on that score. It is increasingly probable possible that the lows for year have already been seen. Upside potential
for the remainder of 2009 - odds 20%
Downside risk for
the remainder of 2009 - odds still relatively high at 40%
Volatility
should decline slowly over the next five months.
We still expect a "retest" of the March lows will occur at some point. Our work
does not point to an end of the bear market
THE CONTENTS OF THE ENTIRE WEBSITE ARE COPYRIGHT 2009 CROSSCURRENTS PUBLICATIONS, LLC I hope you have enjoyed your visit. Please return again and feel free to invite your friends to visit as well. Alan M. Newman, June 29, 2009 
CLICK ICON TO GO BACK TO ARCHIVE MENU All information on this website is prepared from data obtained from sources believed reliable, but not guaranteed by us, and is not considered to be all inclusive. Any stocks, sectors or indexes mentioned on this page are not to be construed as buy, sell, hold or short recommendations. This report is for informational and entertainment purposes only. Persons affiliated with Crosscurrents Publications, LLC may be long or short the securities or related options or other derivative securities mentioned in this report. Our perspectives are subject to change without notice. We assume no responsibility or liability for the information contained in this report. No investment or trading advice whatsoever is implied by our commentary, coverage or charts. |
