|
DATED JULY 26, 2003 A SPECIAL REPORT BY ALAN M. NEWMAN, EDITOR LONGBOAT GLOBAL ADVISORS CROSSCURRENTS |
| Act II of
the mania is clearly in progress. Over the last ten weeks, investment
advisors have averaged 56.7% bulls and only 19% bears, one of the longest
strings of extreme optimism we can remember. Wall Street strategists
have never veered from their bullish path and have kept stock allocations
near record highs. Clearly, television media coverage pays homage
to the "new bull market" and hardly mentions more than the merest possibility
of a "pullback." As for analyst stock recommendations, you would
not believe how things have changed in the last two months but you can
read about it in the July 28, 2003 issue of Longboat Global Advisors Crosscurrents.
If you are not a subscriber, we will eventually place that story in our
September/October update of Pictures of a Stock Market Mania. Seems
the bull is pretty much taken for granted, a circumstance that leaves us
flat when weighing the evidence we see. But you already know how
we feel and hopefully, we can at least add to the mix in this report by
quoting a few other sage observers as well.
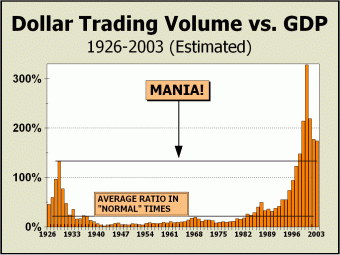
Since our last update, Dollar
Trading Volume has risen modestly to 174.4% of Gross Domestic Product and
remains at nine times the levels associated with "normal" stock markets,
that is all years excluding the mania years of 1928-1929 and 1995 to the
present. To show the extent of the mania on several occasions in
the past, we have cited the daily trading of one stock issue or another,
such as the many fine days when Cisco Systems was in full bloom and traded
as much as 20%-25% of the GDP generated on those days. Despite the
subsequent collapse of Nasdaq, the wheel continues to turn. Drawdowns
in volume have been nominal as the worst is assumed to be over. Ironically,
although the top 100 stocks on Nasdaq are still obviously very aggressive
vehicles for investors, they have grown enormously in popularity via the
QQQ Trust. On June 6th, close to $4.4 billion of the QQQ Trust was
traded, equal to about one-sixth of daily GDP. So, here we have a
case of a derivative product based on a speculative sector of the market
that now trades with the same velocity as the most actively traded individual
stock issues! Unbelievably, some institutions are using the QQQs
as a proxy for the market. Below, a snippet from Alan Abelson's column
in the July 12th issue of Barron's:
In other words, it's an action market and buyers, big and small alike, hedge funds, mutuals and, yes, Jane and John Q, have been going where the action is. Suddenly, the whole world is a momentum player. Man, does that ever smack of '99 and early 2000.
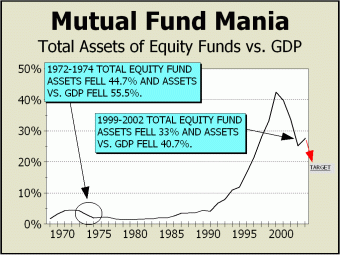
But it is precisely what you might expect in Act II of the mania. When $1.74 in stocks are traded for each dollar spent on goods and services within the economy, we can fairly assume that stocks have taken center stage and are more important than any other facet of the economy. One of these days, we hope to take the time to include the derivative markets as well, to illustrate the entire scope of the U.S. stock market and how it relates to the economy. Ironically, even though $6 trillion in wealth has evaporated, reliance on the stock market is clearly as important that it was at the highs in March 2000. Comparing mutual fund data back to the Roaring Twenties is problematic since mutual funds did not yet exist. However, huge investment trusts did proliferate on the New York Stock Exchange and at their peak, constituted about 8% of total market capitalization versus as much as 26% today for stock mutuals. After the great depression, the trusts simply disappeared. In 1970, more than 7% of the market was represented by mutual funds but the debacle of 1973-1974 killed investor enthusiam, cutting total investment nearly in half on an absolute basis and more than half relative to GDP. Given the two prior periods of excessive speculation, we believe that eventually, enthusiasm will be cut somewhat similarly. To date on an annual basis, total assets have fallen substantially but remain far from our target, which would at the very least, confirm the loss of faith in stocks that we believe will eventually occur. Note that after the 1974 bottom, our line travels even further south and hovers at similar levels for an entire decade as the circle turned. For months on end, net outflows from stock mutual funds were common. That would also be our expectation here; that the ratio fall further and remain lower still for probably five to ten years to come accompanied by a long term of net outflows.
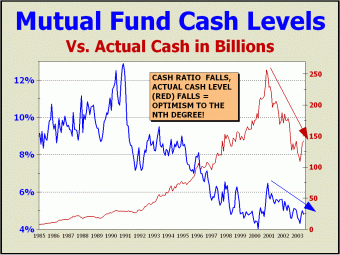
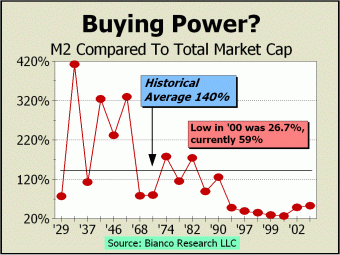
Mutual funds hold cash at absolute and relative levels. Both are important to consider the potential buying power available for stocks. For instance, huge absolute hoards can prevent or end market corrections while relatively low levels of cash can mean a peak in prices. The reverse is true as well, since low absolute levels may be construed as bearish while high relative levels may indeed, be quite bullish. Each of the two indicators is capable of rising or falling. The most bullish circumstance would be if absolute levels of cash were rising while relative levels of cash rose as well. In the first third of our chart, rising levels for both indicators are plainly visible and it is this circumstance that may have catalyzed the bull market and subsequent mania. Then, while relative levels of cash fell precipitously until the manic peak, it is clear that rising absolute levels of cash enabled stock prices to continue their merry way. But now the last portion of our chart shows that both relative and absolute levels have fallen and are still trending downwards. We interpret this as an extremely bearish development. Not only has absolute cash fallen 45% from its peak, relative cash levels are sufficiently near record low levels to assume that mutuals do not have a great deal of flexibility. We note with great alarm that the long term decline in relative cash levels coincides with a far greater acceptance of indexing by both professionals and private investors. By definition, when one places money in an index fund, 100% of the investment goes to work. Clearly, actively managed mutual funds have been trying to play catch up with full investment over the years. In the process, they are losing flexibility every day. The trend is acutely visible and is leading to zero percent cash. We wonder, at that point, whom will be left to buy? How big is the stock market? Still VERY big, judging by our next indicator [source:biancoresearch.com]. Note how the indicator exploded in 1929 from lows approaching the current manic levels to the worst extreme in 74 years. Even at the 1974 and 1982 bottoms, M2 as a percentage of market cap rose dramatically. But money is no longer as important as it once was. Stocks are now the most important facet of our economic life. The obvious answer to the question "where did M2 go?" is "to buy stocks." The obvious answer is also quite visible in the mutual fund cash chart as well! If the secular bear market continues to unwind, this indicator should rise substantially as it has before at the end of two prior secular bull markets. If we are correct, M2 must eventually climb versus market cap. If we conservatively place M2 at 100% of total stock market cap at the conclusion of the current secular bear market and further assume that the bear has five years to run, accompanied by an annual rate of expansion of 10% in M2, total market cap will fall by 14.4% to a figure below the October 2002 low. If instead M2 expands by only 8% per year and the indicator runs as high as 125% (still well below average), total market cap will eventually decline by 37.5%.
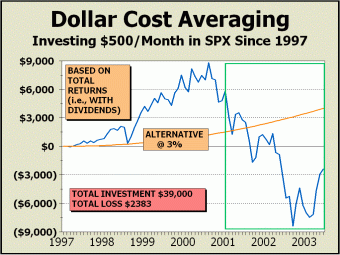
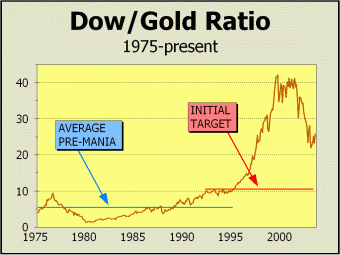
[PORTIONS OF THE FOLLOWING TWO PARAGRAPHS AND CHARTS APPEARED IN THE JUNE 30th ISSUE OF CROSSCURRENTS] Marty Zweig always said, "Don't fight the Fed," and it worked for years, actually for decades. But if there's one thing that is certain, it is that the market is a changeable beast and is never easily read. If enough participants believe something is true, it probably isn't. Our next featured picture points out the most glaring divergence in history between the stock market and a "friendly Fed." The highlighted portion of our chart depicts the 31 months since the Fed began lowering rates; the most incredible easy money period we have ever seen, yet stock prices languish below where they were when Fed commenced easing. As well, investors are still losing money using the financial industry's most potent weapon for buy-and-hold; dollar cost averaging. Thirteen rate cuts have taken rates to negative in real terms and to their lowest level in 58 years. During that period, the stock market has not only not gained any ground, the major indexes are all lower and substantially so. But then again, it took a veritable mania for some to realize that the U.S. stock market has morphed into something quite grotesque as we have gravitated from "owner capitalism" to "manager capitalism." Isn't it ironic that this development was catalyzed by the same higher prices the Fed encouraged by totally ignoring the reality of a growing stock asset bubble? The theme is forward by Vanguard's John Bogle and you can read his views at the Vanguard web site. Bogle also decries the metamorphosis of "financial institutions from being stock owners to being stock traders." The Greenspan Fed has done nothing to stem the tide towards speculation and is running scared as the loss of $6 trillion in wealth continues to reverberate throughout the economy. The only solution we understand is a return to low P/Es and high dividend yields. That could be years away. Gold has lost some of its luster of late but we have great confidence that the yellow metal is still in the nascent stages of a bull market. Our view is that central banks worldwide have been anxious to create a fiat world, one where only paper money counts, backed by the full faith and credit or sovereign nations. However, as the debt of nations around the world continues to expand at alarming rates, the notion of "full faith and credit" becomes a little more difficult to fathom. Plainly put, there are limits and it is possible that those limits have been at least, temporarily achieved. On the other hand, Gold has been a storehouse of value for thousands of years. We do not expect that this alternate purpose for "full faith" has yet expired. In the decade before the stock market mania bubbled into existence, the ratio of the Dow to Gold averaged about 5.4 and then ran eight times higher as stock prices soared to the heavens. In our view, the move since has not been corrective but represents the first stage of a bull market that will at some point, take the Dow/Gold ratio back to levels seen a generation ago. The ratio did not "break out" until shortly after the mania commenced and the "breakout" level is our best guess for a reasonably low target for Gold's bull market. At present levels, this would require either
a double in the price of Gold,
As an example, if the Dow trades down to our long held target of 6400, the ratio target would equate to Gold at $610 per ounce, notwithstanding the possibility of a price correction or two along the way, perhaps even now. As a high side target, one might be persuaded to go with the pre-mania average ratio of 5.4. If this process took five years and the Dow was still at 9000, Gold would then be $1667 per ounce. At Dow 6400, Gold would trade at $1185 per ounce.
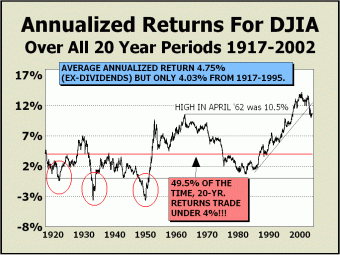
The state of Illinois, strapped for contributions for their pensioners, floated bonds and placed the money in stocks, based on the bogus theory that the long term will satisfy assumptions that stocks rise will 8% or 9% per year out as far as the eye can see. As our next featured picture clearly illustrates, long term returns like those Illinois is depending upon, need not be anywhere near what is required to fund the pensions of future retirees. Ex-dividends, 20-year returns averaged only 4% from 1917 to 1995, before the mania commenced, and have been below 4% almost half of all rolling 20-year periods, including the present mania. If dividends were as robust as they were at the three bear market bottoms in 1974 (5.9%), 1982 (6.7%) or 1990 (4.8%), we might expect Illinois to at least approach their goals, but dividends are relatively scarce at 1.7%. How long can the bear market continue and in the process, disappoint the state of Illinois and everyone else who has fallen in love with stocks? Using a Dow 5000 target as the eventual low, it will be April 22, 2007 before the 20-year annualized average drops to 4%. Why do we arbitrarily select the 4% level? Because it accounts for half of our visible history! If we instead choose our current target of Dow 6400, the 4% annualized average is not achieved until November 17, 2010. If we just elect to consider the Dow trading sideways from it's July 17, 2003 close, the 4% level is not achieved until April 3, 2015. It looks like a long haul to come.
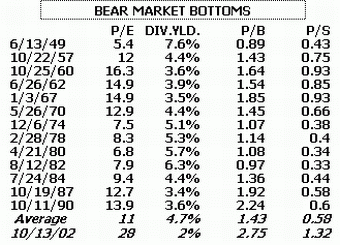
As well, the bond proceeds will ultimately have to be repaid. Thus, what makes this development so truly frightening is that it amounts to Illinois buying their pension beneficiaries stock on margin, mortgaging both the future of the beneficiaries and of the state. Incredibly, on the one hand, we have Alan Greenspan urging consumers to take better care of their finances in TV commercials and on the other hand, we have the states buying stock with borrowed money. There is something seriously wrong with the logic that permits fiduciaries to act in this manner! The top ten issues by market cap account for roughly 25% of total stock market value, so we should assume that Illinois' billions cannot be spent without placing a like percentage into the largest issues. The renewed institutional aspect of the mania is destined to force the lion's share of inflows into the most engorged entities, the market cap monsters of the index funds. If those issues are already overpriced, they must become even more grossly overpriced. P/Es for the Dow, the S&P 500 and the S&P Industrials are now respectively 27.5, 33.8 and 44.1. The top 100 stocks of Nasdaq, as popularized by the QQQ, are trading at a rather lofty 225 P/E. Price-to-book and price-to-sales ratios are off the charts as they have been since the mania really took hold. Just what is reasonable about the decisions of pensions to invest into equities at this point? On December 31, 2001, Barron's showed our featured table, a striking portrait of what bear market bottoms are supposed to look like. Incredibly, the October 2002 low, the alleged bear market "bottom," would instead appear as a tremendous mania blowoff top to a time traveler from the past. Is the future destined to be so radically different from the past? Of course, bulls would have us believe that extremely low interest rates allow today's valuations and allow the possibility of valuations a even higher extremes. Incredibly, this bull camp makes no acknowledgment of the low interest rate environment that that existed throughout much of Japan's 14 year super bear market. Despite the recent huge rally in Japan, the Nikkei index still trades more than 75% below the peak. We expect that U.S. stocks will remain well
below
Much lower valuations are necessary to end the secular bear market.
There is so much wisdom in this business! Pity that we are privy to too few, very brief but acutely brilliant thoughts uttered by a only handful of stalwarts. Don't take our word for it! "Despite three years of falling prices, which have significantly improved the attractiveness of common stocks, we still find very few that even mildly interest us. That dismal fact is testimony to the insanity of valuations reached during The Great Bubble. Unfortunately, the hangover may prove to be proportional to the Note: our Mania reports are now a bit shorter than we are used to presenting but the demands on our time have increased greatly in the last few years. It is our intent to cut back modestly on the free content presented on our website and to concentrate more on the materials we offer to our valued subscribers. In retrospect, we were clearly mistaken to reduce/adjust our high side targets presented earlier in the year. Those targets were Dow 9200-9600, SPX 955-999,1500-1600 Nasdaq and we reduced them modestly to Dow 8728-9160, SPX 948-990 and raised targets modestly for Nasdaq to 1550-1630 Nasdaq. Thus far, closing highs have been Dow 9323, SPX 1011 and 1754 Nasdaq, respectively 1.8%, 2.1% and 7.6% above our high side targets. No pinpointing this time but no disaster either. What is of intense interest to our analysis is that our high side targets were not based upon a return to as much bullishness as we have seen in the last few months. It is quite easy to misjudge emotions within a mania. However, despite the consensus that a new bull market is underway, we believe the rally since October '02/March '03 represents the equivalent of Act II of the greatest stock market mania of all time. Dow 9352-9400 /// SPX 1015 /// Nasdaq Composite 1776 (all print basis - all achieved) Our forecast for 2003
still
places the lows for the year at:
These low side targets
will be adjusted upwards within several weeks
THE CONTENTS OF THE ENTIRE WEBSITE ARE COPYRIGHT 2003 ALAN M. NEWMAN Alan M. Newman, July 26, 2003
All information on this website is prepared from data obtained from sources believed reliable, but not guaranteed by us, and is not considered to be all inclusive. Any stocks, sectors or indexes mentioned on this page are not to be construed as buy, sell, hold or short recommendations. This report is for informational and entertainment purposes only. Longboat Global Advisors, Alan M. Newman and or a member of Mr. Newmans family may be long or short the securities or related options or other derivative securities mentioned in this report. Our perspectives are subject to change without notice. We assume no responsibility or liability for the information contained in this report. No investment or trading advice whatsoever is implied by our commentary, coverage or charts. |