|
CHART DATA COMPILED FROM JULY 22-JULY 25, 2002 A SPECIAL REPORT BY ALAN M. NEWMAN, EDITOR LONGBOAT GLOBAL ADVISORS CROSSCURRENTS |
| The updating
of this website is a tremendous task that requires voluminous data compilation
and research, to say nothing of the planning and construction of our charts.
Work typically begins several weeks before the actual update and although
the markets move, they do not move all that much before publication. This
time they have. A few of the charts seen in the current update
were actually composed as early as Monday, July 22. We apologize
for not being able to be totally up to date and for the brevity of this
report as we prepare for two well deserved albeit brief vacations in the
coming weeks. Our office will be closed from July 30th Through August
5th and again from August 10th through August 18th.
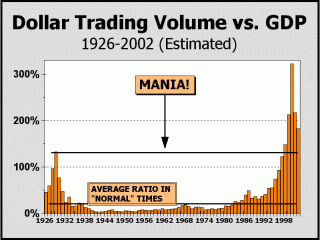
Dollar Trading Volume has fallen substantially from the insane levels seen in 2000, but remains well above the manic levels achieved in 1929. Although prices have succumbed and investor assets have been decimated to the tune of more than $6 trillion, the "man in the street" interviews shown on CNBC still illustrate that hope springs eternal. "The market always comes back," says one young man. And yes it does. Even the 1929 peak was exceeded, but it did take 26 years for that to occur. "The market always goes up in the long run," says another man. Indeed it does. The Dow first exceeded the 100 mark in 1996 and looked back for the last time at 1000 in 1982. As expected, the market went up....but not for good, until 16 years had elapsed. At present, we are witnessing the second worst decline ever in the stock market. Wall Street strategists are the observers with the most clout and incredibly, have maintained large allocations to equities (currently 65%) and very small allocations for cash (currently 5.8%) throughout the decline. But there is clearly an emotional conflict brewing for investors. Mutual fund outflows have increased sharply in recent weeks even while professional observers continue to hang on to their bullish assumptions for dear life. What do we make of this dichotomy? DTV vs. GDP fell a relative 42% from 1929 to 1930, but fell 64% from 1929 to 1931 and has thus far fallen 43% from 2000. Given that the decline in the present era is not as steep as from the 1929 crash, should we now be more confident a bottom is in place? Simply put, we are not certain. We are more impressed by the fact that the records achieved in the recent past indicate a high probability that we have experienced the greatest (by far) stock market mania of all time. If we have, the bear
market should require an unwinding
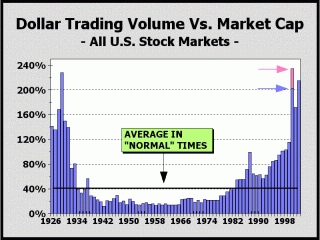
Although the logic of the situation appears to dictate a different outcome, DTV versus total stock market capitalization has actually surged, as if the bears had called a "time out!" We interpret this circumstance as evidence that the mania is still somewhat intact. This strange situation has been brought about as trading volumes have actually increased and remain quite high as market cap deteriorates. Compare the current action with what transpired after the 1929 and 1987 peaks. When markets bust as this one clearly has, trading is supposed to subside after and as investors liquidate their holdings. Instead, trading volumes are even more robust. This is a clear sign that hopes are still high and a clue that good money was thrown in after bad money earlier in the year. As shown in our chart, today's level approaches the absolute peak achieved in 2000 (pink bar), despite a 46% decline in stock prices. Although the records and statistics available for earlier manias are spotty and incomplete at best, we are confident that an identical situation has never before occurred in history. Is this a bullish indication for the next few years? We'd be far more inclined to say "yes" if we had experienced a washout in trading with volume subsiding markedly as hopes were crushed. Instead, volumes have increased. We believe investors
do not yet comprehend
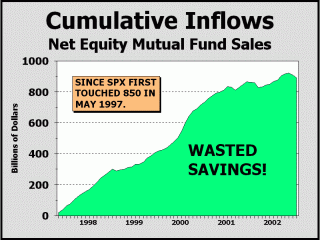
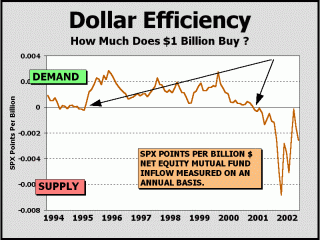
We have showen our Dollar Cost Averaging chart several times and today offer a slightly different perspective of just how badly investors have been had by this supposedly fool proof strategy. Suffice it to say, no strategy offers an iron clad guarantee. On Friday, July 19th, the S&P 500 traded at 850, the first time the index had traded at that level since May 1997, consistent with the timeframe we have previously shown in our Dollar Cost Average charts. Since that point, at which the SPX first attained the 850 mark, net inflows into equity mutual funds have totaled $890 billion. At their peak, net inflows were as high as $920 billion. Given that prices are no higher now than they were in May of 1997, the enormous sum invested has toiled for no gains. Investors would have been better off in T-bills. The problem that attends higher prices is that the higher they go, selling becomes a more attractive proposition and buying becomes less attractive. Throughout much of the mania, investors were convinced that prices could rise 20%-25% per year, year after year and thus, continued to pour their savings into the market. But as prices moved to stratospheric levels, eventually no amount of net inflow could buy further gains, much less sustain prices. As the next picture clearly shows, over the last year, positive inflows were unable to buy gains and only resulted in losses. When such a point is achieved, there is a real risk that losses may accelerate since there is no apparent need to invest! That is precisely what has occurred. Note that twice our indicator attempted to climb back into positive territory and was unable to do so. Also note that the period of rising prices (see arrows) were entirely accompanied by positive efficiency. What will turn the indicator to positive? Lower prices have made stocks more attractive and may have already catalyzed the bear "time out." The specific price level required for this circumstance is at worst, probably nearby on an intermediate basis but is likely to be lower for those interested in long term returns.
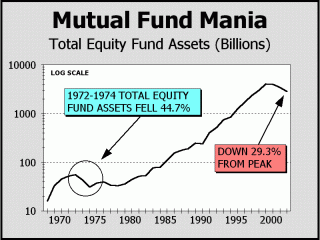
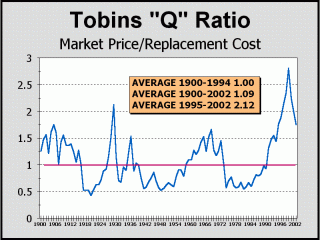
If we are correct that many small investors will eventually desert the stock market for alternative investments, then prices will eventually either fall much further or take far more time to recover. Stocks as percentage of household assets rose from the 15%-18% level during the early 1980's to well over 50% at the peak in 2000. Given the growing recognition by investors of the need to pursue savings for retirement, we do not necessarily expect a full round trip back to the levels of 1982, but the environment that permitted the mania and the excesses that spawned Enron, Global Crossing, Adelphia and Worldcom can certainly have unnerved investors to the point that reliance on stocks will decline and that stocks will fall to 20%-25% of household assets. As seen below, total stock mutual fund assets plunged more than 44% from 1972 to 1974 but have only fallen 29.3% thus far. If the pattern matches the earlier bear market, net assets versus GDP will fall an additional 21.1% from current levels. In the final analysis, stocks will always trade at fair value at some point in the future. Prices cannot be above or below fair value forever. Very low prices must eventually attract buyers. Very high prices must eventually catalyze sellers. Tobin's Q Ratio measures how expensive or cheap the entire stock market is by dividing the total market value of corporations by the total replacement cost of their assets. In theory, if the ratio is above 1 it would be more profitable to sell shares to the public. If the ratio is under 1, it would be more profitable to buy corporate shares. As our chart illustrates, for a period of 95 years up to and including 1994, Tobin's Q Ratio was dead on at an average reading of 1. Sure, there were swings to levels above zero and then below zero but over time, Q always reverted to the average. The mania temporarily changed all that as mass insanity permitted participants to believe that no price was too high for stocks. From 1995 when the mania probably commenced to recently, "Q" has averaged 2.11, meaning one had to be literally crazy to pay for stock assets which could far more easily be replaced by creating the same company from scratch. And of course, that is why so many companies were created and then sold to the unsuspecting public as "hot" initial public offerings that could double or triple in only one day. At the current level of 1.75, "Q" is still way too high by 75% and can, at some point, be expected to revert to the long term average. Stocks are still way too expensive.
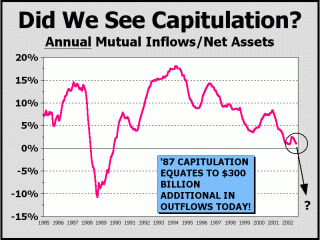
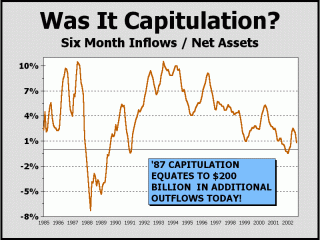
In our last update, we claimed that "capitulation remains elusive." Clearly, we were 100% correct. Given that we ventured this opinion with prices already far below where they began the year, the additional 21.7% declines on the Dow, 24% on the S&P and 21.5% on Nasdaq in only the 44 days since our last update are proof positive that capitulation had yet to occur. Has capitulation finally taken place? The good news is that over the short term, the answer is a resounding "yes." It appears the bears have finally called for a "time out." The bad news is that over the long term, capitulation still remains quite elusive. Although equity mutual fund redemptions have surged in the last two months, the annual rate of change is still positive and only about the same level as it was last September. After the greatest stock market mania of all time, one might easily be persuaded to believe outflows must occur on an annual scale. One might also easily be persuaded that outflows could conceivably resemble what they were in 1987 as the market crashed. Since August and September of 2001 resulted in outflows and the current annualized rate is $27.8 billion of net inflows, we would still need to see a sharp increase in outflows for a negative annualized change! In fact, an additional $62 billion in net outflows must occur for the annualized rate of change to be negative by the end of September. Even more frightening is that $300 billion in outflows would be required to equal the exodus suffered in 1987. [NOTE: WE ARE ESTIMATING $30 BILLION IN OUTFLOWS FOR JUNE AND JULY] The six month measure of capitulation provides an additional perspective and only implies that shorter term, a sufficient "surrender" has now taken place. Unfortunately, longer term confirmation is still lacking. The current rate of change is approximately $28 billion in outflows better than the September 2001 bottom and is about $200 billion better than the vast and very brief exodus and panic generated during the crash of 1987. Again, we must reiterate that shorter term, we believe enough damage has occurred for the stock market to modestly regain some footing and perhaps even to make a few tentative attempts to recover. Longer term, however, the unwinding of the
mania
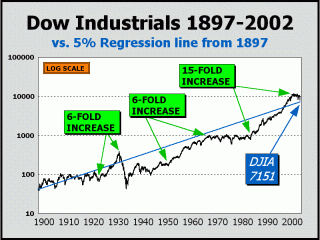
Stocks always regress to the mean. It might take years, perhaps a decade, perhaps even a few generations, but the really long term is carved in stone. The reason is quite simple to comprehend. For the sake of argument, let us presume that for some inane reason, a new era had indeed arrived and stocks were capable of 15% annualized gains ex-dividends as far as the eye could see. Folks would begin to ignore other assets and just buy stocks, particularly with pension funds. The prospect of compounding 15% annually would allow retirement at a much earlier age than otherwise possible, certainly by 50-55. Within a few decades, the number of retirees with huge cash hoards would increase geometrically. The demand for those still remaining in the labor pool would also increase geometrically, as would their wages. With so much cash saved, folks would enhance the quality of their retirement by spending, spending more, and spending still more. Soon, inflation would surge and the cost of goods and services would soar as well. It doesn't take much assuming 15% returns. After 25 years and a modest 1.5% increase in savings each year starting from a mere $2000 annual contribution, a retiree would have $615,000 to play with and after 30 years, $1.26 million. There is concrete proof that 15% annual returns are way too attractive to be realistic for longer term periods and that proof has already been seen in the stock market mania and the subsequent unwinding of excesses now underway. The two prior super bull markets we have highlighted rose six-fold; the current mania rose 15-fold, further proof of its legitimate categorization as a full fledged mania and clearly, additional reason to expect that prices will probably eventually regress not only to the average, but possibly even well below! As of last week, an average 5% annual return would place the Dow at 7151, only 8.4% lower than today. We have showed this picture several times
in the last two years
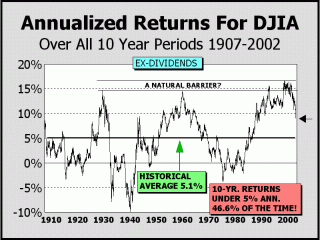
Until now. As previously predicted, ten year annualized returns have finally begun to drop rapidly from unsustainable levels. After peaking at 16.6% in May of 1998, returns ex-dividends continued to hang at levels never seen before until January of 2001. Nearly as often as not, the ten year return has been below the 5% level. [ED NOTE: THIS FIGURE WAS INCORRECTLY STATED WITH THE RECIPROCAL IN OUR PRIOR UPDATE] We expect that these returns will again journey back to their historic norm. Given the eventual passing of the greatest stock market mania of all time and that there have already been so many instances of much lower 10-year returns, we must consider the possibility that returns may even make a complete round trip to zero percent at some point. For returns to fall to 5% three years from now, the Dow would trade at 7680, almost as low as the July 24, 2002 low. For returns to fall to zero percent five years from now, the Dow would still only trade at 8110. In fact, prices have been so high and for so long that a zero percent return in ten years would equate to - believe it or not - 8019, lower than today!
In conclusion, we have experienced sufficient capitulation to postulate that stocks may be able to put together modest gains immediately ahead. Most of our technical indicators ran to the most oversold levels we have seen since the Crash of 1987. However, long term capitulation is the only way the bear market can end and that circumstance is nowhere near at hand. Lower prices for the remainder of 2002 are still possible, albeit far less likely than before. All bear markets eventually have "corrective" rallies. Whether prices have bottomed here and now or require a retest in the fall, we believe the odds favor that 2003 will be an up year. This "bullishness" should not be misconstrued. In our view, the bears have only called a "time out." We expect the bear to regroup and eventually, resume. The secular bear market has not concluded....
A small portion of the charts and analysis presented here are usually shown in our newsletter weeks and months in advance of their appearance on this site. If you haven't already, we urge you to take advantage of our FREE 3-issue trial (see link below). We have now hit all our targets for 2000, 2001 and 2002. Many months ago, we offered a forecast that "The September 21st low was very likely the low for the year [2001]....we believe the SPX could trade as high as 1249 (1177 much more likely) before the end of the year." We pretty much nailed the top print which came in at SPX 1173.62 on December 5, 2001 and actually called for a December 6th high in our newsletter. As it turns out, the high since the September '01 low has been 1176.97 registered on January 7, 2002, only .03 from the "much more likely" high we had initially pegged. Our downside targets
(offered at 2 in 3 odds) for 2002 have been achieved!
The low prints of Dow
7532 / SPX 775 / Nasdaq Composite 1192
Further downside is
entirely possible - support should be expected at:
Our best case scenario
for the remainder of 2002 is:
Alan M. Newman, July 25, 2002 All information on this website is prepared from data obtained from sources believed reliable, but not guaranteed by us, and is not considered to be all inclusive. Any stocks, sectors or indexes mentioned on this page are not to be construed as buy, sell, hold or short recommendations. This report is for informational and entertainment purposes only. Longboat Global Advisors, Alan M. Newman and or a member of Mr. Newmanís family may be long or short the securities or related options or other derivative securities mentioned in this report. Our perspectives are subject to change without notice. We assume no responsibility or liability for the information contained in this report. No investment or trading advice whatsoever is implied by our commentary, coverage or charts. |
