|
CHART DATA AS OF JANUARY 10, 2002 A SPECIAL REPORT BY ALAN M. NEWMAN, EDITOR LONGBOAT GLOBAL ADVISORS CROSSCURRENTS |
| On October 9, 2001, five
Goldman Sachs analysts released a report citing Enron as "still the best
of the best," and "strongly" reiterated their recommendation, with the
expectation that the shares would "recover dramatically in the coming months."
Earnings estimates for 2002 were cut to $2.15 and the price target was
cut to $48, representing a 43.5% improvement from the October 9th close
of $33.45. Truth be told, we expect that even the finest analysis
can sometimes go awry as expectations are dashed by the realities provided
by time; as plans do not work out and as strategies backfire. But
very rarely will we ever see misjudgments on this scale and proved within
mere days of their positioning! Granted that management was
less than forthcoming, but Goldman's analysts said, "We recently spoke
with most of top management; our confidence level is high." Is the
onus only on those who are not painting the complete picture or is it also
on those who are viewing it through rose-colored glasses? We believe
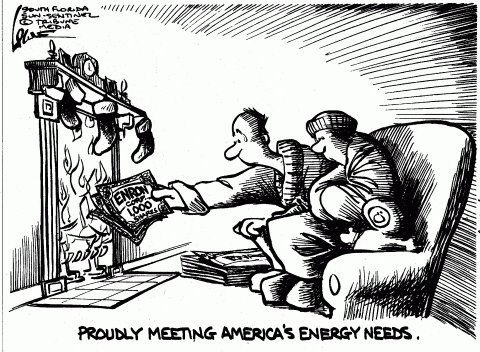
trust has taken a very large turn for the worse. The case of Enron
represents a watershed event, a confirmation of a process already underway
since December of 1996 when Alan Greenspan pondered the possibility of
"irrational exuberance" and then like comedian Steve Martin, apparently
posited "nahhhhh!" Given that the seventh largest U.S. company could
make it to the junk heap of history in such a short time along with dozens
of high tech and internet fave choices of professionals from only a year
before, it would appear that the tide has certainly turned. The rationale
for trust has all but evaporated. Stocks should fall out of favor
for a long time to come.
REPRINTED
WITH THE PERMISSION OF THE SOUTH-FLORIDA SUN-SENTINEL
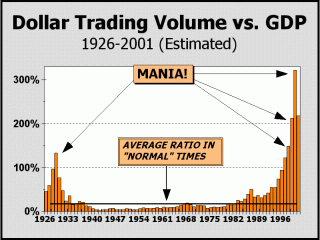
In 1927, the Roaring Twenties mania really began to take off. The Dow Industrials gained a resounding 25% and Dollar Trading volume surged to nearly 60% of the country's GDP. The following year, prices rose close to 40% and as the word spread that Wall street was paved with gold, DTV rose to nearly 97% of GDP. By the end of 1929, as we have shown repeatedly, DTV had surged to 133% of GDP. But rather than dwell on the year end, what about the 1929 peak? Prices rose a further 34% into the mid-September peak and we can make a fair extrapolation that DTV may have surged as high as 207% of GDP at the very top. Can it be that the current mania was every bit as bad? Although margin loans with 90% leverage have not been available, home owners have nevertheless been able to take tremendous advantage of second mortgages, home equity lines of credit and credit cards to augment their spending, while availing themselves of margin loans with 50% leverage. The result is an near enough approximation of the insanity of 1929, allowing margin debt to reach 2.62% of GDP in 2000, the second highest level ever. Although the comparison to 1929 seems to pale, the offset of whatever mortgage money went into stocks clearly made up for the relatively "conservative" attitude of modern speculators. Coincidentally, DTV was 345% of GDP at the very peak in 2000, two-thirds higher than the 1929 peak! And in the month of October 2000, $3.076 trillion was traded in stocks, or nearly $140 billion every trading session, five times the amount of money spent for goods and services in the economy for each of those days! The most important
facet of the U.S. economy in 1929 was stocks.
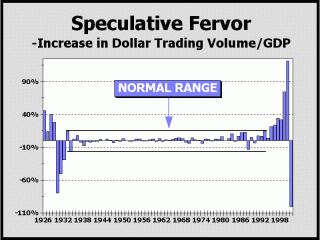
Has the mania concluded yet? Has the back of the mania even been broken? Truth be told, we're not sure. Every time we think sensibilities are beginning to return, something like Enron comes along and lets us know with perfect clarity how much greed and ignorance remains entrenched in the chase for equities. But Speculative Fervor has clearly contracted. In theory, by measuring the increase (or decrease) in DTV versus GDP, we can see the expansion or contraction in speculation. Of note is the expansion in the Roaring Twenties and subsequent contraction in 1930-1932. Logically, one would expect a huge contraction in speculation after the mania had peaked. Given how far the mania of 1995-2000 exceeded that of the Roaring Twenties, one would also expect a far greater contraction than in the '29-'32 bust. Also, one might expect the contraction to last at least as long - at least three years. This would mean much more pain to come. A one year contraction in speculation is not sufficient to offset the prior excess.
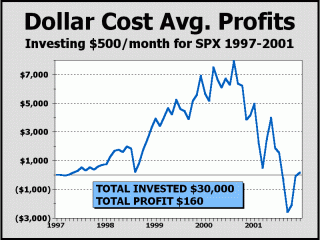
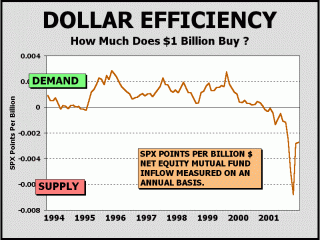
The downside of the mantra can clearly be seen in the chart at left below, using the "magic" of dollar cost averaging for the last five years. Every professional's sure fire plan for retirement (or investment of any kind) relies on Dollar Cost Averaging since the logic is so compelling and the math so correct. Simply put, you put aside $X per month (or quarter) and invest. When prices are low (cheap), you buy more shares. When prices are high (expensive), you buy less shares. As always, the market is expected to rise over the long term and this method can logically be expected to provide the sensibility that can otherwise only be provided by market timing. As we see here, even five years of dollar cost averaging in one of the greatest bull runs of all time was not all it was cracked up to be. We should caution that we have not accommodated the receipt or reinvestment of dividends, but one of the more veridical aspects of the last five years is that dividends have been inconsequential, averaging only 1.3%. Tacking on the receipt and reinvestment of dividends would have expanded annual returns to a little more than 1.3%, less than half of what would have been earned with zero risk in Treasury bills! Ironically, the most trusted weapon in the bulls' arsenal is a bust! Annualized Dollar Efficiency turned negative in November 2000 and has not looked back. What made the trip into negative territory so unusual was that the twelve months to November 2000 were accompanied by a net inflow of more than $320 billion, the third largest annualized inflow of all time! Since efficiency was already near break even when the two largest annualized inflows occurred in September ($336 billion) and October ($334 billion), it is painfully evident that prices were so high that almost no amount of money could buy further price appreciation. Of course, this is what a major stock price peak is all about! When prices are too high, selling becomes irresistible. Yet, almost all of Wall Street's trusted financial firms were looking for higher stock prices. If $320 billion invested over the course of a year cannot raise prices, what will?! Despite the optimism continually displayed
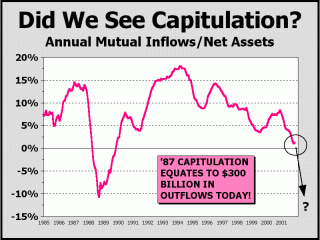
by financial firms,
1987 was indeed capitulation as annualized outflows reached a negative 10% of total mutual fund equity assets. Given the end of a veritable stock market mania is in progress, we believe mutual fund outflows stand a fair chance of eventually equaling or exceeding the 1987 experience. Since today's market is considerably larger than in 1987, a similar outcome would at some point, equate to net outflows of more than $300 billion. To those who would argue (logically) that a bear market was already in force from April 2000, we would add the fantastic irony that inflows totaled a huge $194.6 billion from April 2000 through January 2001! The power of the mania was so great that even as Nasdaq fell 34.4%, inflows equaled 4.6% of total assets! For the first time in history, the puncture of a bubble went almost totally unseen and the public continued to pour money into stocks! If we place the beginning of the recognition phase from the first two months of outflows in February and March of 2001, net outflows are only $11.3 billion and represent three-tenths of one percent of net assets. A capitulation along the lines of '87 is the furthest circumstance from investors' minds, but we should certainly expect that at the end of a mania. As bear markets go, the one underway has
been quite tame
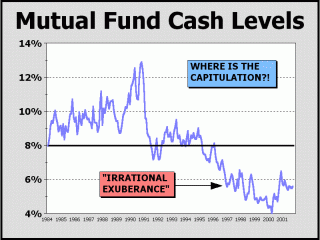
Another parameter we must consider and likely just as important is mutual fund cash levels, now 5.6% of assets. Of the seven bear markets since 1966, the average bear killing level was 10.3%! The lowest of the bear killing cash/assets level was 8.8%, which approximates a 36.4% decline in share prices from today, given zero redemptions. Note the average cash level since 1984 is 8% and that cash levels today are no better than when Alan Greenspan mused "irrational exuberance" in December of 1996. Today, mutual fund managers believe they must be fully invested and of course, that is the only way to beat the competition in a rising market. But the presumption that markets always rise has led to this consistent overexposure to risk. The longer prices remain below the highs of 2000, the more likely the rationale for full investment will reverse and the more likely cash levels will rise. As cash levels rise, buying (demand) will necessarily decrease.
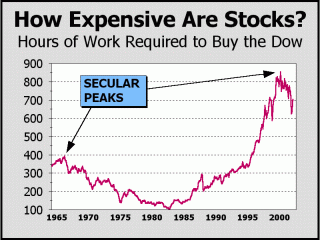
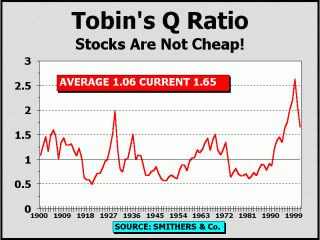
Our argument in favor of a bear market is certainly not very convincing unless we can show that stock prices are actually still high, but high is a relative term. How does one illustrate "high?" At left below, our estimate for 2001 still places stocks as measured by the Dow in nosebleed territory. After peaking at 855 hours in December 1999 required the Dow contracted to 592 and now stands at 660. Given the 308 hour average dating back to 1964, stocks would appear to be overpriced by at least 100%. The prior secular peak in 1966 was the beginning of a phase in which this particular valuation measurement was reduced by 75%! Will investors continue to pay top dollar for expensive merchandise? At right below, Tobin's Q Ratio represents the market value of publicly traded assets divided by their replacement value. The further above 1 that this indicator trades, the more effective it is to start a business or perhaps to buy it privately. The further below 1, the more effective it is to purchase a publicly traded business. Over time, the average has been 1.06, a rough approximation of fair value. In fact, measuring from 1900 to 1994, before the mania commenced, the average was exactly 1 and was actually below 1 more often than above (48 to 47). The Smithers & Co. view below right is as of October and has not yet been updated by the company. At the 1999 peak of 2.63, it was insane to even consider buying many publicly traded companies. Simply put, it was far easier to achieve value by starting a business - probably the key reason why so many brand new internet companies were foisted upon the public. Obviously, the prices paid were way out of line with reality. And stocks are still extremely expensive by historical standards.
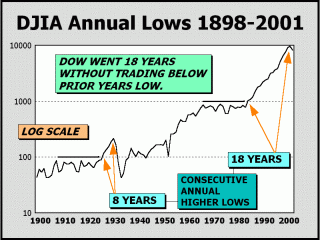
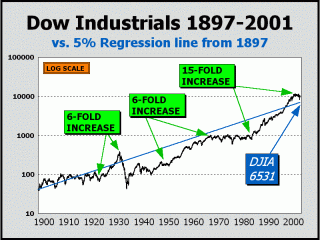
Last year witnessed the end of one of the longest streaks in stock market history. For 18 years, the Dow Industrials had not traded below the prior year's low, a streak so far in excess of the previous record of 8 years achieved in the Roaring Twenties, that one would certainly have been excused for believing in a "new paradigm" for stocks. But nothing endures forever, not even great secular bull markets. So, the streak ended last year and the question is, "what now?" We hasten to point out that five times the Dow traded below its prior annual low in consecutive years (1911, 1921, 1938, 1970, 1978). We would also hasten to point out that three times the Dow traded below its prior annual low for three consecutive years (1913-1915, 1930-1932, 1940-1942). Given that the last consecutive downside "streak" occurred long ago, in 1978, we believe the odds favor a downside repeat for 2002. Contrary to popular wisdom, stocks as measured by the Dow do not go up 15%, 12% or even 10% per year. But it is true that with dividends, stocks have averaged about 8% over many decades. However, most folks are thinking about the averages and are not accommodating the payment of dividends, which are quite scarce nowadays. Without dividends, stocks have returned about 5% per year since 1900. Thus, our 5% regression line is a fair approximation of where stocks should trade at almost any point in time. Of particular note are two prior super bull markets; the one that ended with the Crash of 1929 and was up six-fold and the one that ended in 1966 the first time the Dow traded above 1000 (from 1966-1972, the Dow never traded more than a few percent higher than in 1966). In the latter super bull, prices were also up six-fold. However, in the super secular bull market of 1982-2000, prices rose 15-fold, the most spectacular rise in stock market history. The compounded annualized gains amounted to 16.9%, more than triple what history had shown was sustainable and sufficient reason for many professionals to abandon their trust in history and posit a "new paradigm." Obviously, the Crash in Nasdaq and near 40% haircut in the S&P 500 gave the lie to the "new economy" and the brave new world that investors were led to trust. As seen below, a return to a 5% regression would result in the Dow Industrials trading at 6531, ironically only a smidge above where Alan Greenspan pondered "irrational exuberance" in December of 1996. If the line is met three years out, the Dow will trade at 7552. If the line is met five years out, the Dow will trade at 8286. If the line is met ten years out, the Dow will still only be 10572, nominally higher than today! Trust in the long term mantra at your own risk, as we have said again and again.... "The long term offers no guarantee other than the passage of time."
Trust has taken a huge turn for the worse, placing investors in a terrible position. Whom can they trust? The Enron debacle is just one circumstance, albeit a horrific example of how top analysts can be misled by corporate management. And as the shares toppled into penny status, 500 key employees were paid $55 million in bonuses, employees were frozen from selling 401(k) shares for 30 days and then bankruptcy was declared and 4000 employees laid off! What of the aggressive use of pro forma earnings statements that have inflated S&P earnings by some estimates, as high as 50%? And now that the FASB have changed the rules to force goodwill write downs, we will see just how foolish and untrustworthy corporations have been. America Online is expected to write down as much as $60 billion, amounting to $13.55 per share and about 42% of total market capitalization. The news will come shortly after the retirement of AOL's CEO Gerald Levin, who made $1 million last year, with a $10 million bonus and $152.6 million in profits from the exercise of stock options, to say nothing of pension benefits. Amazingly, there is now ample speculation that as much as $1 trillion in write-offs are in store for the U.S. stock market, perhaps 8% of the market's total capitalization. And what of Wall Street strategists? None saw the end of the bull market, yet we are to believe them when they all now see the end of the bear market? None saw the recession coming, yet we are to believe them when they all now see a boom ahead? Whom can an investor trust? Stocks remain the biggest business there
is.
Some of the charts and analysis presented here are shown in our newsletter weeks and months in advance of their appearance on this site. If you haven't already, we urge you to take advantage of our FREE 3-issue trial (see link below). We hit our targets for both 2000 and for 2001. In our last update, we said "The September 21st low was very likely the low for the year....we believe the SPX could trade as high as 1249 (1177 much more likely) before the end of the year." We pretty much nailed the top print which came in at SPX 1173.62 on December 5th and actually called for a December 6th high in our newsletter. Our initial targets for 2002 are presented below. Our downside targets
for 2002 are as follows (2 in 3 odds):
Our best case scenario
for 2002 is as follows (low probability):
Alan M. Newman, January 10, 2002 All information on this website is prepared from data obtained from sources believed reliable, but not guaranteed by us, and is not considered to be all inclusive. Any stocks, sectors or indexes mentioned on this page are not to be construed as buy, sell, hold or short recommendations. This report is for informational and entertainment purposes only. Longboat Global Advisors, Alan M. Newman and or a member of Mr. Newmanís family may be long or short the securities or related options or other derivative securities mentioned in this report. Our perspectives are subject to change without notice. We assume no responsibility or liability for the information contained in this report. No investment or trading advice whatsoever is implied by our commentary, coverage or charts. |
