|
- THE GREATEST STOCK MARKET MANIA OF ALL TIME - DATED FEBRUARY 18, 2006 A SPECIAL REPORT BY ALAN M. NEWMAN, EDITOR CROSSCURRENTS This feature is now published on a quarterly basis. Our next update will not be published until possibly as late as mid-to-late May 2006. |
| This is our
52nd report on the ongoing mania since we first published this website
on January 15, 1999. Well over three million visitors have read our
free features and well over one million visitors have visited this particular
page.
A world map of our readers from 76 countries can be viewed HERE. Run your mouse over each country! This report is now mostly a compilation of articles that have previously appeared in the Crosscurrents newsletter. Our paid subscription stock market newsletter has only two rationales for its existence; powerful commentary and unique perspectives that cannot be found anywhere else. Please check out the testimonials on our Kudos page. To purchase a printable file of "Frenzy & Churn" for $10, please CLICK HERE
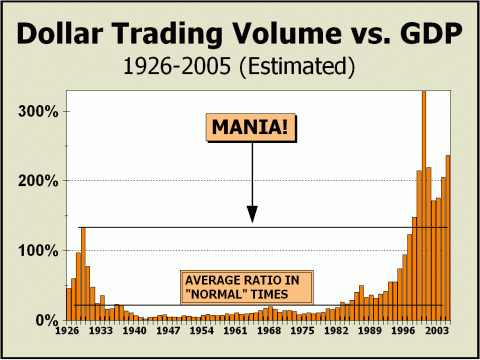
We have bad news. We're not sure how much longer we will provide our tallies for Dollar Trading Volume. Most importantly, there is so much noise now from sector and index ETFs that we can hardly know how much trading is generated by real, live investors and how much is generated by black box computer programs. Our point in illustrating activity all along has been to show how immersed the public was in stocks. At this point, although we still very much believe the public remains fully immersed, our DTV measurements have become quite suspect for our purposes. It may be entirely possible that we missing the point - that all of the trading now generated in sectors and indexes show even more emphatically, the extent of the mania. However, in the future, we may instead elect instead to show a different series; that of total stock market capitalization versus gross domestic product. We're still mulling that decision over. Ken Safian of Safian Investment Research and Jim Bianco at www.biancoresearch.com have long championed this perspective and it may be high time that we follow in line. Meanwhile.... $30 Trillion in Frenzied Activity We are sufficiently confident to show the chart below as a reasonable estimate for year-end 2005 [chart may be updated again next week]. Clearly, activity remains at manic levels, despite prices well below their peaks of six years ago. Imagine how much churning has been required to bring prices back from their nadir! In the last three years, $12 trillion in activity has been required to generate a $4 trillion increase in market capitalization. Another $4 trillion in market cap would result in a brand new record for the U.S. stock market, but if another $12 trillion in activity is the only way to get there, DTV would also trade at a brand new record. What are the odds that the greatest stock market mania of all time would break all the records again a few short years later? We would guess the odds are zero.
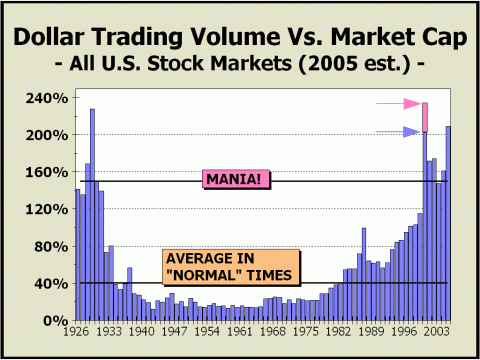
Vis-a-vis total stock market capitalization, we are already quite close to the manic peak as volume in sector and index ETFs has exploded in recent years. The lower blue arrow points to the end-of-year data. The higher pink arrow points to the pace of activity at the very top in March 2000.
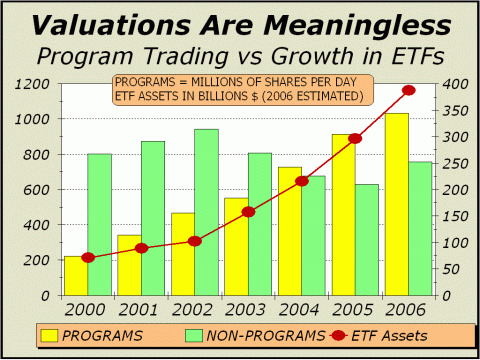
For a startling perspective of today's activity, consider the following: one of every $16 trading in the U.S. market is in the S&P Spiders. The Spiders, the Nasdaq QQQQs, The Dow Diamonds and the Russell 2000 ETF (IWM) trade a total of roughly $3.6 trillion, close to 12% of all activity and over 28% of GDP! In accomplishing this absurd feat, the Dow Diamonds are the laziest of the four indexes, but still manage to trade 9.3% of their capitalization each day. The IWM is the busiest - unbelievably - trading nearly one of every four shares outstanding each and every trading day! As a result of the phenomenal growth in sector and index trading, program trading has soared from less than 20% of NYSE volume a few years ago to close to 60% now. "Traditional" investing and trading has slowed perceptibly. [Below, an excerpt from the February 13, 2006 issue of Crosscurrents, illustrates our point.] The strangest aspect of the U.S. stock market is the constantly heard theme that valuations are at acceptable (perhaps even attractive!) levels. This near Pavlovian conditioning (see http://tinyurl.com/brzxf) has in our view, been the carefully planned result of the financial industry's attempt to garner and control assets. In the process, sectors and indexes have been morphed into salable products rather than investments. Like toothpaste or cola, the packaging changes or is "improved" from time to time in order to attract new and more consumers. Exchange Traded Funds (ETFs) are the most popular theme in packaging. Unlike mutual funds, they trade on exchanges just like stocks and can be bought and sold with tremendous ease. But the simple fact remains, as measured by the S&P 500, which represent better than 80% of the market, stocks are overvalued and have been for nearly all of the last eight years. Nevertheless, ETFs continue to grow like wildfire, reining in assets at an average pace of 42% per year over the last half dozen years [note: chart estimates data for 2006]. Assets in mutual funds have grown at only a 3.4% pace since 1999. Last year, ETF assets rose 31% to very near the $300 billion mark and at the same pace are on target to reach nearly $400 billion this year. Assets in the Spiders, which track the S&P 500 index, rose to $58.4 billion and the number of ETFs rose from 144 to 190. As ETF assets have grown, so has the pace of program trading. And as the pace of program trading has increased, traditional trading and investment has declined considerably. Traditional trading and investment focuses on fundamental and valuation considerations of individual corporation prospects. Can ETF sector or index investors do the same? Would Graham & Dodd ever approve of this style of investment? Although there are certainly undervalued constituents in each sector or index, if the sector or index trades at historically high valuations - as now - it is very likely that a majority of constituents are overvalued - some by a wide margin. Ironically, as long as the trends away from traditional trading and towards sector and index trading continue, this dichotomy can only worsen. We are very much in a phase where fundamentals and valuations for individual companies are quite meaningless, except at the most macro level still practiced by a dwindling number of value oriented money managers. Even in this pursuit, many managers are forced to participate in the accumulation of overvalued sector and index constituents to compete and survive.
The chase into paper assets has culminated in a complete repackaging of the product. Despite the "new and improved"
aspect,
Caught Up In A Frenzy - Again [EXCERPTED
FROM THE DECEMBER 19, 2005 ISSUE OF CROSSCURRENTS]
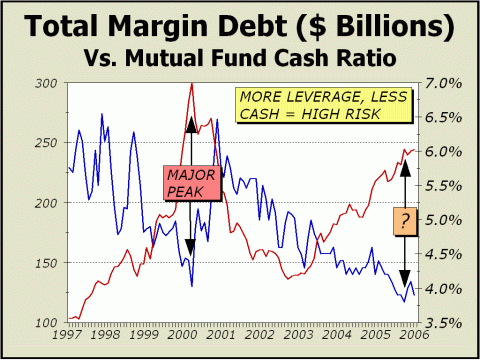
In our last issue, we offered the insights of JP Morgan strategist Jonathan Golub, who claims investors are "mentally anchored" to the peak prices of the mania and are unable to comprehend the scope of the three year rally from the October 2002 bottom. To repeat, Golub believes the Feds accommodation resulted in another round of "speculative behavior. The strategist cited two statistics; companies in the S&P 500 that have lost money have risen close to four times as much as the index and companies that have had executives indicted have risen close to five times as much as the index. Our question: need one even look for further confirmation of extreme speculation? Judging by other sentiment measures, such as the Investors Intelligence survey of newsletter writers, the mutual fund cash-to-assets ratio, and the Rydex fund ratios, there is every reason to believe that participants are caught up in a frenzy - again. But since prices still remain far below their all-time highs, the common wisdom is that the bull market has a lot of room on the upside. Furthermore, three years of higher prices unaccompanied by any substantial price correction are sufficient to convince participants that no price correction will be forthcoming. The circumstances have again enabled rampant speculation, albeit certainly not on the same scale as the fateful manic peak. Nevertheless, current valuations have only been exceeded four times in market history; 1929, 1973, 1987 and 2000. Each of those occasions were followed by rapid and momentous declines in stock prices. Exactly how much additional evidence do we need to claim that investors are in a similar position of risk, as they were at the four prior major peaks? More evidence of frenzy: margin debt at NASD clearing firms rose to yet another new high in October, more than 5% above the manic peak of March 2000. Although margin debt at NYSE clearing firms fell in October by 2.4% and combined margin debt fell a nominal 2%, total market capitalization also decreased by roughly the same amount, or 1.8%, in October. Thus, total margin debt as a percentage of total market capitalization remained near where it was in September and close to the same inflated level it was just before the huge price collapse commenced in March 2000. The odds clearly favor at the very least a prolonged time out as occurred when last years rally concluded. Soon....
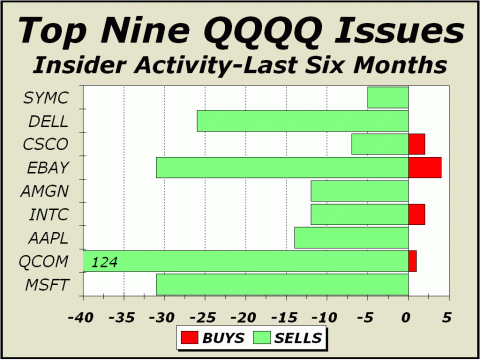
Massive
Insider Selling Continues
As Nasdaq kicks up repeatedly to new highs for the year, insiders continue to aggressively sell their holdings. Every few months, we examine ten of the top Nasdaq issues to monitor the confidence insiders maintain in their stock. Apparently, not much. Given the ratios of sellers to buyers and shares sold to shares bought, there can be no question that insiders rate their company stock as tremendously overvalued. For the current go-round, there are only nine stocks in our analysis, since information on the tenth issue, Comcast, is currently unavailable. Suffice it to report that the top nine issues in QQQQ index are valued by the market at a hefty $932 billion, a fair sized chunk of the entire U.S. stock market and close to 40% of the QQQQ Trust, the most popular speculative trading vehicle ever launched. Our last look in the May 23rd issue of Crosscurrents, found a seller/buyer ratio of 31.6, up from 18 to 1 back in September 2004. Although the ratio has fallen nominally to 29.1 to 1, we would certainly not rate this small decline as encouraging, since close to 2000 shares were sold for each share purchased. Ebay accounted for four of the nine buyers overall but it is extremely difficult to put a happy face on insider buying when you compare the 15,000 shares of Ebay purchased versus nearly 120 times that number, or a total of 1,793,000 shares sold. The average P/E ratio for the top nine Nasdaq companies was 33.4, up from 29.3 in our last tally. Dividends of course, are next to nothing, so those who remain in their company's stock are quite dependent upon the share price to add to their wealth. And clearly, they are selling stock in sufficient quantity to dispute any notion that any continuation of a rising stock price is guaranteed. One "excuse" we often hear is that insiders are selling shares in order to "diversify." However, we are positive that diversification does not involve purchasing other shares in the QQQQ. And given that insider sales appear quite robust outside of just Nasdaq, we'd be very surprised to see any of the proceeds going into stocks at all. Thomson Financial shows an overall dollar sell/buy ratio of 22.2 for the month of November, the third highest ratio of the year. After both the July ratio high of 28.7 and the March ratio high of 25.8, stock prices fell. So, you say, insiders are still massive sellers yet Nasdaq and the QQQQs are up in price? Why should we believe continued selling by insiders has any relevance? Well, for one thing, it sure did in March 2000. But most obviously, if insiders are selling in massive quantity, why would you or anyone want to place their pension money in the same stocks? If they were such wonderful long term investments, why wouldnt insiders tend to be holders, instead of sellers? One answer we have harped on for several years is indexing. Charles and Louis-Vincent Gave and Anatole Kaletsky wrote recently that, The more money flows into indexation strategies, the more capital gets invested according to size, and the more capital is misallocated. This can only lead to a lower return on invested capital, which, in turn, can only lead to a lower growth rate and, more often than not, to huge disturbances in price levels. As the late 1990s craze showed, indexation is a guarantee for capital to be wasted, which automatically leads to lower growth and lower long term returns on the stock markets. So we could have a very paradoxical result: indexers might keep outperforming but the long term returns of the stock markets will fall, as a sign that the economy's structural growth rate is falling. The top Nasdaq issues all
have a prominent place in the S&P 500 index. Just a few weeks before
the 2000 peak, Microsoft was #1, Cisco #3 and Intel #6. The subsequent
dénouement in our view, was concrete proof that indexing does not
work. Although there is plenty of evidence that the mania itself
was responsible for the bloated valuations in the three companies, we must
accept the fact that more than 10 cents of every indexed dollar was nevertheless
destined to buy additional shares of those overvalued companies.
We can
only assume insiders know what they are doing....
Irrational
Exuberance: Act II
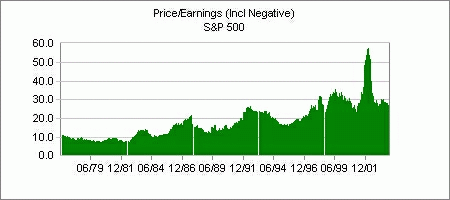
The second edition of Irrational Exuberance is now on the bookshelves. Yales Robert Shillers first edition hit stores at almost the exact same time the mania peaked in March 2000. He was certainly on the mark at that time. Even though prices are well below the manic highs now, professor Shiller still believes they are way too high. Investors, both private and professional are still irrationally exuberant. Shillers primary thesis centers on a ten-year moving average of earnings, using the S&P 500 Price/Earnings ratio. The ten-year average ratio is roughly 25, tremendously higher than the historical long term average of 15. Even the current multiple of 18.9 is considerably higher, strongly suggesting that valuations are extremely high at this time. Just one quote from page four tells us a lot. Shiller writes, .[higher prices] have created a sense among the investing public that such high valuations, and even higher ones, will be maintained in the foreseeable future. Yet if the history of high market valuations is any guide, the public may be very disappointed with the performance of the stock market in coming years. Everything we view leads
us to the same conclusion as Shiller. Participants are convinced
that a brave new world exists and that the new order will prevail, despite
the terrible fall out from 2000 to 2002. In other words, all the
lessons the mania offered have been ignored.
2006: A Return To Average
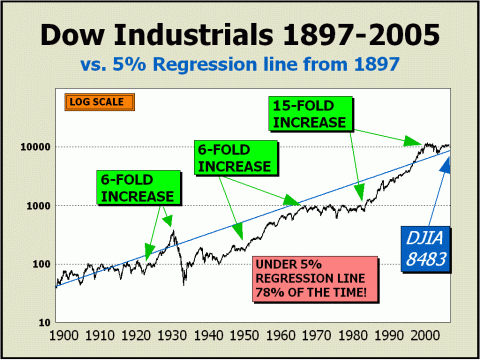
If there is one aspect of the last 20 years that has impacted investor psyches more than any other, it is the presumed permanence of gains. The longest bull market in history resulted in a unique perspective, it didn't matter how poorly you invested, the long term would always bail you out. Note that even a two-year halving in the S&P 500 did not temper investor's appetites. More Americans now own stock than ever before and total assets of mutual funds are at a record high. Ironically, the investment of choice for many is indexing, a methodology that can only afford average performance, since it replicates the most significant stock market "average." John Bogle has been called "the Father of Indexing." Bogle is the founder of Vanguard Group and the Vanguard S&P 500 Index fund is the largest and thus, the most successful fund of all time. Of course, the Vanguard S&P 500 Index fund has garnered its huge success by NEVER once beating the market. What a strange world. We couldn't make this stuff up if we tried. On the other hand, Bill Miller runs the Legg Mason Value Trust, which has outperformed the market for 15 consecutive years. The odds of Miller's success being due to luck alone are roughly 930,000 to 1. It would seem that the manager knows a thing or three. However, Bogle claims that Miller's success is, "the greatest tribute to indexing we have around," explaining "....if only one person can do that out of 5000 mutual fund managers, it would suggest the odds aren't great." Our question is should one ever expect a money manager to outperform the S&P for 15 consecutive years? If one outperformed the average in only seven of 15 years with less drawdown and higher overall returns, wouldn't that be sufficient? Are we just supposed to cull Peter Lynch, John Templeton, Warren Buffett and other successful managers from the investing hall of fame, and relegate their reputations to luck or randomness alone? It is painfully obvious that if one chooses to instead go the route of the index, one is necessarily relegated to "average" performance. Can that really be the best option? The venerable index closed at 96.47 in 1967 and closed at 96.11 in 1978, earning investors less than the dividends they received over 11 years. The index closed at 71.55 in 1961 and closed at 68.56 in 1974, earning investors zero, zilch, nada, nothing at all after 13 years. We could go on with examples but what's the point? The point is that the "long term" guarantees nothing but the passage of time. Investing in an index guarantees poor returns if the market does poorly. And if history is any guide at all, long periods of outsized returns are always followed by periods of meager or even negative returns. Clearly, the two periods of super-sized gains from the secular bull markets leading to the 1929 and 1973 tops were followed by long periods of disappointing "average" performance. The process is called "reversion to the mean." Given that history has shown that even 5% over the long term is reasonable, perhaps a reasonable investor's expectation should have been for lower rates of gains into the late 60s and mid 70s. Gains over the last twenty years are an amazing 10.1% annualized, Since gains have been so robust in recent times, perhaps we should be thinking that "average" will not be so generous for the remainder of this decade and possibly even further out in time. As our chart below illustrates, returns for stocks as measured by the Dow Industrials have been below 5% (ex-dividends) a startling 78% of the time, far more often than most observers, including professionals, would guess. Given the extremely long time frame represented, it would appear logical that the 5% reference point is fair. Can the brave new world of the 21st Century imply a far higher rate of return for stocks? Why would it? If there is a common thread throughout the decades, it is the cyclical nature of demand for all asset groups, including stocks. Stocks were the only place to be for 18 years, from August 1982 to March 2000, and have been the place to be since October 2002/March 2003. Only one time out of roughly three years in a 23+ year span. Phenomenal. Not only has the span of good times been the longest in history, it has been the best performing by far. Even if we were to assume a brave new world exists and returns will remain above the 5% mark more often than below for years to come, a reversion to the 5% mean should still represent a very real risk on the downside for investors. Note that the regression line currently stands at 8483, down 22.6% from today. This line will rise to only 8899 by the end of the year. We believe the line represents fair long term value for the Dow Industrials and it is difficult to comprehend how it will not be touched repeatedly as the cycle for paper assets loses favor. Are we being unfair to stocks in our analysis? Considering that the Dow remained below the 5% regression line every week for 60 years from January 1939 to January 1996, we do not. The only time since January 1996 that the Dow has even touched the regression line was for precisely one minute at the absolute lowest print on October 10, 2002. Although there are reasons for us to suspect that year-end prices may look similar to where they began the year, somewhat like 2005, we do not believe the intervening months will resemble the boring non-volatile environment of the preceding year. The cyclical bull market that commenced in October 2002 (or March 2003, depending upon how you look at the charts), is already quite old. Plus, all bull markets are punctuated by significant price corrections, and that has yet to occur in this cyclical bull. During the Twentieth Century, there were 68 instances of price corrections measuring 10% or more, one every 1.44 years. Thus far, since stocks bottomed in October 2002 and March 2003, the largest price correction has been roughly 8.7% and a 10% or larger correction, equivalent at present to roughly Dow 9863 and SPX 1156, has not occurred since 1999. A 15% or larger correction, equivalent to Dow 9315, SPX 1092, occurred on average every 2.23 years in the last century, implying that even a decline of that magnitude should come as no surprise at this stage. A 20% or greater correction has occurred every 3.77 years, implying that a window of extreme danger opens anywhere between June 2006 and the end of the year. Thus, whether we believe that the bull will endure OR that the next leg of the secular bear begins, we should expect a significant decline at some point this year and above all, finally, a considerable expansion in volatility. 2006 also marks the second year of the Presidential Cycle. Although the cycle has proved favorable since 1950, averaging gains of 5.7%, the cycle itself has been quite volatile. Of the 14 second-years, six have witnessed gains of 15% or more but four have seen declines of 10% or more. The last two declines were in 1974, down 27.6%, and 2002, down 16.8%, and both years were in the midst of bear markets. Given we are in the continuing secular bear market camp, we think a downside episode this year is not only quite possible, but probable. However, our long held downside target of Dow 6400 for the secular bear market now seems improbable. We are not giving up entirely on the thesis for a return to the poetic justice of the level at which Alan Greenspan pondered "irrational exuberance," but clearly, the odds have diminished substantially for a resolution of that magnitude. Simply put, it is extremely difficult to now imagine a catalyst on the horizon capable of generating a more than 40% collapse in prices. If a downside of that magnitude was going to occur, the catalyst should have been unfolding well before now and impacting stock prices. Moreover, 2007 will be the third year of the Presidential Cycle. The last 14 third years have all been positive, averaging 18.5% gains, and we expect to be modestly bullish before the end of the year. Thus, we are running out of time for our worst case bear scenario and a more likely bottom for 2006 would appear to be a modest dip below our regression line to somewhere above Dow 8000.
Stocks remain on overdrive. As we claimed in our last report, although prices remain far below their peak, confidence is off the charts. The cash-to-assets
ratio of mutual funds
Total
margin debt is higher than it was at the end of December 1999,
Margin debt at Nasdaq clearing firms is at an all-time record high. Frenzy....
2000
2005
Churn....
We have now established a new secondary secular bear market low target, corresponding with the regression line in the chart above. Dow 8000/8500 - SPX 980/995 - Nasdaq 1750/1775, between 20%-25% lower than today. Caveat: these levels could be achieved several times in the next few years and it might be another decade before a new secular bull market is capable of taking all of the major averages above the peak achieved in 2000.
High
Targets for 2006
Low
Targets for 2006
Low targets for 2006
may now represent
THE CONTENTS OF THE ENTIRE WEBSITE ARE COPYRIGHT 2006 CROSSCURRENTS PUBLICATIONS, LLC I hope you have enjoyed your visit and please return again. If you know anyone who might be interested in seeing what we have to offer, we'd be happy to have them visit as well! Alan M. Newman, February 18, 2006
All information on this website is prepared from data obtained from sources believed reliable, but not guaranteed by us, and is not considered to be all inclusive. Any stocks, sectors or indexes mentioned on this page are not to be construed as buy, sell, hold or short recommendations. This report is for informational and entertainment purposes only. Persons affiliated with Crosscurrents Publications LLC may be long or short the securities or related options or other derivative securities mentioned in this report. Our perspectives are subject to change without notice. We assume no responsibility or liability for the information contained in this report. No investment or trading advice whatsoever is implied by our commentary, coverage or charts. |