|
- THE GREATEST STOCK MARKET MANIA
OF ALL TIME -
DATED AUGUST 25, 2008 A SPECIAL REPORT BY ALAN M. NEWMAN, EDITOR CROSSCURRENTS This feature is now published on roughly a quarterly basis. Our next update will likely be published in early or mid December 2008. |
|
Our readership
is still growing.
This report is now mostly a compilation of articles that have previously appeared in the Crosscurrents newsletter. Our paid subscription stock market newsletter has only two rationales for its existence; powerful commentary and unique perspectives that cannot be found anywhere else. Please check out the testimonials on our Kudos page. To see a free sample copy of the Crosscurrents newsletter, CLICK HERE Printable
files of this report are available only to paid subscribers.
Ironically, we have been too bullish on the prospects for the current year, while we have clearly and correctly stressed both systemic financial problems and the ongoing mania for paper assets, especially stocks. We can claim with complete accuracy that we called the derivative crisis. Our previous reports have all been archived and paid subscribers have access to all newsletters published since December 2002. See the January 2008 issue of Pictures of A Stock Mania for a list of archived issues that discussed derivatives in detail. Write offs for financial companies now exceed $500 billion and we believe at least another $500 billion is likely to vanish. Incredibly, the beat goes on for stocks. Despite the background of a slowing economy and a credit crunch, the sheer velocity of stock trading continues at levels never seen before.
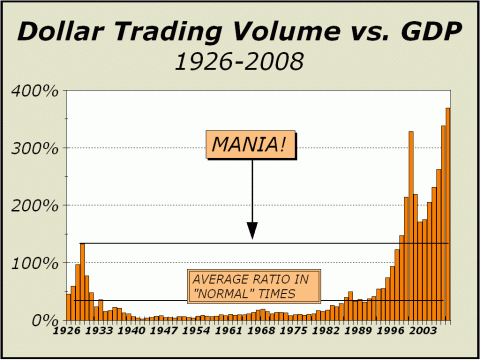
The only good news we can report for investors is evidence that the derivative crisis may finally be taking a toll on the stock market, exerting a modest drag effect on the velocity of trading. Our thesis is quite simple; the higher the velocity of trading, the less effective the rationale for investment. Data through July indicates the annualized rate of total Dollar Trading Volume (DTV) has contracted by 5% from our previous report of a yet another new record pace in May. The bad news is DTV remains on an awesome growth track. Since 2002, when stock prices bottomed after suffering their worst bear market in decades, DTV has been rising at an annualized rate of 19.3%. Gross Domestic Product (GDP) in the first six months of the year grew to over $14.2 trillion. At the current pace, DTV will total close to $53.4 trillion this year, 367% greater than the size of the economy. What is more important, the stock market or the economy? It's not even close. The last year that GDP exceeded DTV was 1996, very early on in the period that witnessed the greatest stock market mania of all time. In fact, prior to 1996, DTV had only been higher as a percentage of GDP in 1928 and 1929. The mania known as the "Roaring Twenties" was then followed by a 64-year stretch in which DTV averaged less than 17% of GDP. Nevertheless, the country survived, grew and prospered. However, in the modern era, much of our growth has stemmed from the expansion of our financial arena and our prowess in manufacturing financial structured products rather than industrial products. "Product" no longer means autos or televisions, but means exchange traded funds or swaps agreements. Our goals seem to have taken a full one-hundred-and-eighty degree turn and in this Editor's view, we are finally beginning to feel the effects. Step back and look around.... despite an excellent five years from the October 2002 bottom to the October 2007 top, stock prices as measured by the S&P 500 and Nasdaq remain mired well below their 2000 peak. The S&P 500 represent close to 80% of total stock market capitalization, thus stocks have essentially gone nowhere. The 2000 peak was undeniably,
a mania.
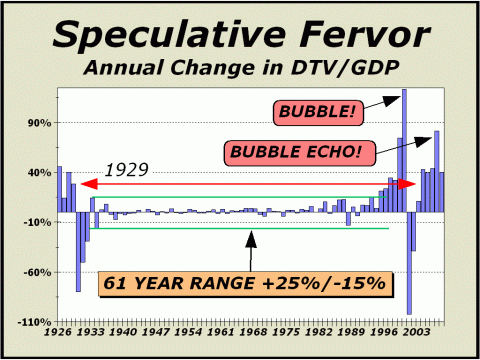
Our Speculative Fervor chart below attempts to measure overall levels of speculation by simply dividing the annual changes of both DTV and GDP. If GDP is growing more rapidly than DTV, there is a lesser focus on stocks. If DTV is growing more rapidly than GDP, there is a greater focus on stocks and thus, a presumption of speculation. Clearly, the peaks in 1999 and 2000 represent a veritable mania. If you remember the period, you will recollect that Nasdaq was on everybody's lips and probably everyone you knew was buying growth issues at a huge and unsustainable multiple of earnings. At one point, the Nasdaq Composite index traded at 250 times earnings, a level never seen before, or since. Incredibly, Speculative Fervor spiked again in 2007 after "resting" for three years at levels that still exceeded the Roaring Twenties and remains at extremely high levels to this day. A bubble has been followed by a bubble "echo." Given the rather pathetic outcome of the "bubble," we are not optimistic about the resolution and dénouement of the "bubble echo."
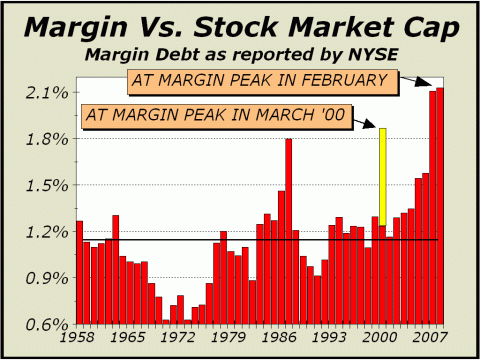
Final and compelling evidence of the extent of the mania is clearly visible above. Margin debt as a percentage of total stock market capitalization was substantially HIGHER in February 2008 than at the peak (see yellow bar) in March 2000. The red bar represents year end levels expect for the current year, which is shown through July. Oh, and that other huge red bar spike? That's 1987, the year the stock market crashed. Borrowed money.... Is it any wonder that stocks are finding the upside difficult? Stock market capitalization
is roughly $15.7 trillion.
All signs point to a significant contraction in speculation ahead.
The following article is reprinted
from the June 2, 2008 issue of Crosscurrents.
"Four Hours, Eight Minutes & 40 Seconds" Last September, we presented a piece entitled "The Death Of Investment," wherein we portrayed the immense and stupendous turnover in a half dozen selected Nasdaq issues along with five popular exchange traded funds. We termed our lead chart of ET turnover, "without any reservation, the most stunning we have ever presented in these pages." Through 1187 words and three pictures, we attempted to establish beyond any doubt that the investment arena had been totally transformed in the modern era. A metamorphosis, if you will. We believe this process undermines the consideration of fundamental values as a measurement for price. The public holds a large fraction of their retirement wealth in stocks through mutual funds, IRAs, 401k plans and the like. For the most part, they are content to have professional money managers do the hard work of earning the security for their retirement by investing in the right companies and at the right price. However, in the modern era, trading is paramount, not investment. The psychology of managing stock assets has changed radically and has degenerated into something that cannot be accurately termed investment. Whereas years ago it may have been prudent for managers to invest for results over the long term, the competition for assets is the greatest in history and immediate results are required for survival. Those who post the better results over shorter periods are those most likely to survive. Results are advertised with increasing frequency and increasing scrutiny. Managers are now too impatient for the big payoff, thus academics and institutions have given us new methodologies to “play” the market and to even utilize black box formulas and arbitrage opportunities of every description and size, including the almost infinitesimal. The smallest differentials in stock prices can now be multiplied sufficiently against derivatives for profits to be constructed. If the process is repeated often enough, profits can be enormous. Whereas most stock was once purchased for investment using tried and true fundamental factors, most stock is now turned over too quickly for those factors to even rate consideration. As a consequence, for the most part, stocks are not fairly valued per se. Clearly, we can make the case that the more a company's capitalization trades, the less the company's stockholders are interested in a long term driven by fundamentals affecting the company's future. If a company's capitalization turns over once a year (or less), perhaps we can safely assume investors are aboard and banking on longer term prospects. However, if a company's capitalization turns over rapidly, we can probably assume it is only the moment that counts. The longer the holding period, the more likely fundamental prospects are important. The shorter the holding period, the less likely fundamental prospects are important. Cases in point; prices were so overvalued in 1929 that there was no point in holding positions, thus turnover was enormous. The same was true in 2000. In both cases, dollar trading volume tripled in the three years to the top. Extremely high turnover equates to OVERvaluation. By contrast, total turnover during the entire period of 1940-1954 was minimal, less than in the single year of 1928. Dividends averaged 5.5%. Stocks were incredibly UNDERvalued. Values remain hidden when trading
slows to a crawl
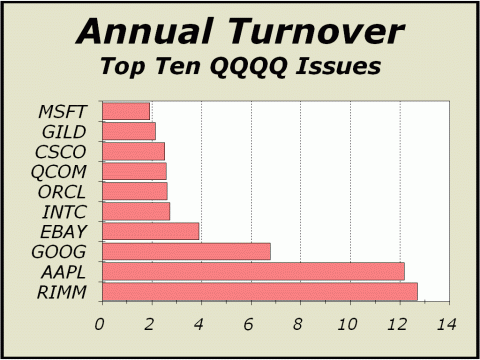
Rather than purposely “selecting” individual issues for examination as we did last September, we choose today to highlight the annual turnover of the top ten issues trading in the Nasdaq QQQQ Trust. The top ten issues represent 47% of the entire trust and total over $1 trillion in market capitalization, clearly a significant portion of the entire U.S. stock market. As our featured chart illustrates, investment has been left far behind by trading. The largest issue of the top ten is Microsoft, which sports a market capitalization of $273 billion, a relatively staid and stodgy companion to some of the more high profile high flyers. MSFT is surely a linchpin of many a mutual fund, IRA, 401k and the like, yet even “softees” entire capitalization trades almost twice per year. In what must go down as the most fickle market in all history, the average of the top ten trades its entire capitalization more than five times per year. Incredibly, the entire capitalization of Apple (AAPL) and Research in Motion (RIMM) turnover at a pace more rapid than once per month.
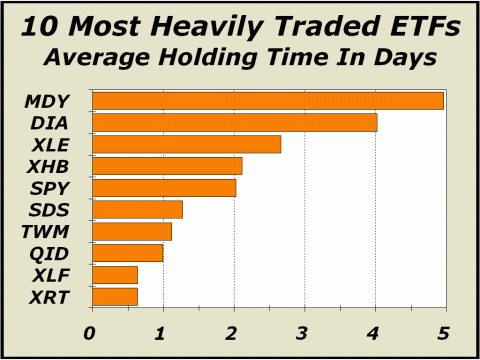
However, these astonishing rates of turnover do not even remotely compare with those of the most heavily traded exchange traded funds, where holding times are best expressed in terms of days, not months. As illustrated below, despite promotional advertising touting many ETFs as “investments,” nothing could be further from the truth, patently visible to even the blindest of observers. Three of the ten most heavily traded ETFs turn their entire capitalization within the span of one day. In fact, by 1:38 pm, both the Retail SPDRs and the Financial SPDRs are likely to have turned over their entire capitalizations from the market opening at 9:30 am. A grand total of only four
hours, eight minutes and 40 seconds
The words “heavily traded” are insufficient to define or describe the sheer velocity at which many ETF shares pass from one owner to another. At current rates for the ten issues shown below, close to $12 trillion in dollar volume will be traded this year. The S&P SPDRs alone are quite likely to be responsible for over $8 trillion in dollar volume. Three of the issues are short their respective sectors and will trade nearly $1 trillion in dollar volume. A list of the top 25 most heavily traded ETFs also includes three additional issues that trade their entire capitalizations in less than one day; the Retail HOLDRs (RTH), Ultra QQQ Proshares (QLD) and the Oil Service HOLDRs (OIH). Bear in mind that each long trust holds shares of the underlying companies in the respective index or sector and those that are short the respective index or sector are short either the shares or have derivative positions that equate to the short side. In the case of those that own put options, bear in mind that market makers retain the right to short shares without locating shares that can be borrowed. As a consequence, they are likely to fail to deliver shorted shares, creating additional supply out of thin air, since each shorted share necessarily must wind up as a long share “entitlement” in a customer's account. The U.S. stock market has been totally transformed by this institutional lunacy, wherein investment has taken on a far smaller role than anytime before. We can only reiterate the obvious; the more stock trades on a short term basis, the less relevant are fundamental valuations and corporate prospects. Subsequently, individual stock prices have a smaller correlation with their prospects and a larger correlation based simply upon their relative position in a sector or index. Pricing inefficiency is far more likely to result in overvaluation, rather than under valuation, since holding periods are so brief. The shorter the holding period, the less risk is incurred, thus the more risk can be accommodated. The result for the modern era has been a perennially overvalued market. Those who only two months ago cheered as the S&P 500 P/E ratio fell to the lowest level in years (!!!), have now been blindsided by earnings shortfalls that have ballooned the P/E back to a grossly high 22.9 P/E. Never mind that the historical median P/E ratio of 15.2 has not been seen in nearly two decades!
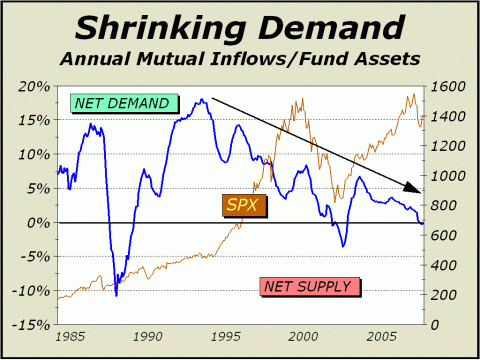
Below, it is no wonder that mutual fund inflows continue to contract relative to assets. The new era of sponsored institutionalized velocity means less relevance for long term investment, hence less reason for investment in mutual funds. Exchange traded funds are winning the battle for assets and in the process, may have mortally wounded the investment arena. Annualized net outflows occurred only twice before in the last two decades but as of the end of April, net outflows are again in view. The most striking aspect of the chart is the long term trend. As long as turnover is the name of the game, as long as short term trading takes precedence over long term investment, mutual fund inflows will continue to contract relative to ETFs. Worse yet, mutual funds may experience constant outflows. In either case, prices must eventually suffer.
The measurement of fair value
for corporate prospects requires
The following article is reprinted
from the July 21, 2008 issue of Crosscurrents.
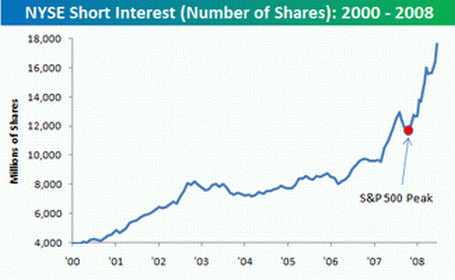
Please visit the source, Bespoke Investment Group for more stunning analysis. "Metamorphosis Redux" It has long been our view that the SEC exists not to serve the public, but to serve the financial industry. Sadly, the SEC has absolutely no handle on the metamorphosis of the U.S. stock market from an arena of investors to a veritable menagerie of traders who believe the capital formation system is meaningless. We have rendered the rationale of investment useless and bankrupt. The mechanical methodologies and short term tactics that rule today's arena ensure that value is no longer a significant factor in the price of securities. Incredibly, even the number of shares issued by a corporation to trade on the exchanges is now in question. Corporate capitalization can no longer be trusted. The Depository Trust & Clearing Commission (DTCC) is the keeper of the vaults; a private corporation that is actually owned by banks, brokers and dealers. As such, the corporation has little incentive to protect investors but much incentive to protect its owners. We have reason to believe the corporation's clearing operations are suspect. The opacity of the DTCC's business is beyond disturbing. They are responsible for keeping track of all shares owned and shorted and our measures of trading velocity offer evidence that the system is so overloaded by transactions it is likely impossible at any point in time to determine with complete accuracy who owns what. Most importantly, we have reached the point at which the industry must recognize the short sale mechanic that previously served us well, is now broken. While the circumstance that initially catalyzed our critique was the huge number of phantom shares generated by failures to deliver shorted stock that were never legally borrowed, it is now clear that the mathematics of short sales cannot support the wholesale and widespread shorting that occurs in today’s radically metamorphosed stock market. Re failures-to-deliver, if a short sale is not backed by a borrowed share, then no bona fide can possibly be delivered to the buyer on the long side of the sale. How can we possibly assure the buyer that any genuine value has been received? The "share entitlement" placed in the buyer's account is not a real share of stock, nor does it receive real dividends nor does it receive a real vote on corporate matters. Disturbingly, even the delivery of properly shorted and borrowed stock results in a “security entitlement” for at least one participant. The result is at least two “owners” displayed by brokers for each shorted share. The creation of a share "entitlement" is essentially nothing more than an open-ended futures contract. Importantly, listed companies purposely set and limit their capitalization for many reasons, not the least of which is to ensure the possibility of raising additional capital in the future. The ability to raise said capital is lessened with each shorted share. We believe the continuation of wholesale shorting cannot possibly benefit the public. The process, if utilized on a massive level, as it is today, harms the market. One of every 17 shares in the S&P now has more than one “owner.” Given that total short interest is skyrocketing, the ratio will likely be worse tomorrow, next week or next month. In little more than two years, total short interest has more than doubled. Interestingly, there appears to be a correlation between the phenomenal increase in total short sales and the phenomenal growth in ETFs, some of which are short sectors or entire indexes and in relation to derivatives, such as put options. Bear in mind that neither individuals, nor hedge funds, nor ETFs need short actual shares to take bearish positions. Bear bets can be placed simply with the purchase of put options. However, these transactions have the potential to generate massive naked short sales by market makers in order to hedge their positions. Under current SEC regulations, market makers can short stock without borrowing shares. In essence, they can create phantom shares where none should be. What is the point of establishing a set number of shares authorized to trade when the set number can be so easily circumvented and inflated? Can there be any benefit to shareholders? Where does it end?!
For Bear Stearns, it ended rather poorly and so abruptly that there has been considerable speculation about a contrived crisis. Trust took a huge hit in March as rumor mills operated 24/7 (see http://tinyurl.com/6cunrw). Although the SEC is scouring trading data surrounding the rapid collapse (http://tinyurl.com/5b2uc6), we'd be shocked to see any indictment of manipulation. Simply put, it is in the SEC's and Wall Street's interest to sweep the incident under the rug, like all others before, lest the public lose confidence in the U.S. stock market or the supposed venerable institutions that run the show. Importantly, if John Olagues' take on the Bear collapse is to be believed (http://tinyurl.com/5vqght), the U.S. stock market is as corrupt an arena as we could ever fear and our complaints about a broken short sales system has always been right on the mark. Given Mr. Oleagues' ten year background as a stock options "market maker" on the Chicago Board Options Exchange and the Pacific Options Exchange and a reputation as one of the foremost options market makers in the world, his opinions deserve exposure. The story has only received attention on the internet and has not been covered by the major financial media, yet the facts presented are so bizarre and so controversial that one can only wonder why the SEC is unable to crack down. Then again, as we have said on many occasions, the SEC's mission statement is a fraud. Protection exists only for Wall St. and not for the public. Oleagues' March 23rd comments centers on the charge that the collapse of Bear was engineered. The evidence is in the options arena, catalyzed by the creation of highly suspicious out of the money puts. These puts were so far out of the money with
so little time left to expiration
There is also considerable speculation that the deal was put into place to save the much larger JPMorgan at the expense of Bear shareholders. Bear in mind, while Bear’s shares opened trading at $53.95, put options to sell the shares at $5 commenced trading! Worse yet, the tremendous increase in trading velocity seen in today's stock market almost guarantees that the DTCC has lost the ability to track the multitude of transactions, including short sales. Case in point; although the iShares Russell 2000 (IWM) is an exchange traded fund, it nevertheless is a trust wherein the shares of the various Russell 2000 constituents have been deposited. There are 150.65 million of these trust units, each backed by shares. However, when we include the ETF shares “owned” by those on the long side of each short sale, banks/brokers/dealers can count amongst their customers, "owners" of at least 304.22 million units of the trust. The requirement that "shares" be borrowed before they can be shorted has quite obviously been effectively avoided in this circumstance. Then again, the IWM is not the only case. Try the iShares Dow Jones U.S. Real Estate Index Fund (IYR) on for size, if you will. There are 22.3 million "shares" outstanding for the trust, yet the venerable NYSE counts 66.6 million short in its most recent tally, three times the theoretical maximum. If you continue to doubt the importance of this matter, please refer once again to the chart above. Note that at mania’s peak in 2000, slightly more than four billion shares were tallied as short. Despite the relative absence of short sales at that time, the S&P 500 managed to be sliced neatly in half. The supply created by an additional
14 billion shares
The common wisdom is short stock positions must eventually be covered and are thus, bullish indicators. Nothing could be further from the truth. Both long and short positions can remain open indefinitely. Incredibly, speculators need not even short shares; all they need to do is open put positions in whatever size they desire and which will tend to force market makers to short a like number of shares, however large in number! The short sale mechanics of
our market
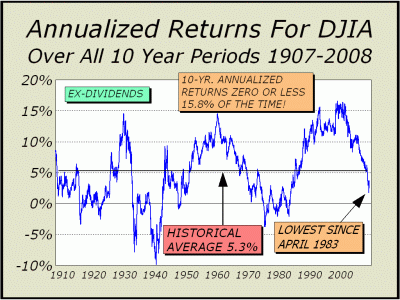
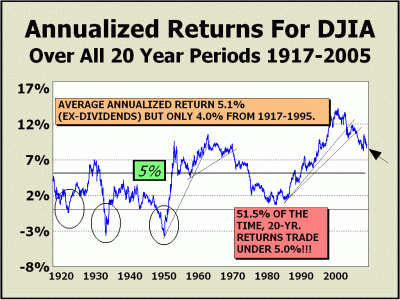
Decade long returns have finally succumbed to the great secular bear market that commenced in March 2000. At left below, our ten-year annualized measure of Down gains ex-dividends is now down to 1.74%, the lowest in over 25 years. However, at right below, the 20-year annualized measurement still clearly benefits from the surge in prices experience during the years 1995 to 2000. Ex-dividends, the Dow has gained 8.61% annualized for a generation.
If 20-year annualized returns
are destined to fall to 5%,
How long? Just going sideways for the Dow will take another six years and eight months. At Dow 10,000, it will take another five-and-a-half years.
We have reduced our upside targets for the remainder of 2008 by approximately 5%. It appears that there is neither sufficient time nor firepower for stocks to recover to the extent we previously anticipated. Bear in mind these are best case scenarios. To see a free sample copy of the Crosscurrents newsletter, CLICK HERE
High Targets for
2008 (best case scenario)
- odds 30%
If achieved, the highs are likely to occur in December. Most likely end
of year rally targets - odds 50%
Our Low Targets for 2008 were nominally exceeded. Our
projected lows are STILL viable targets in the September/October time frame!
The 15% correction occurred as we had forecast. THE CONTENTS OF THE ENTIRE WEBSITE ARE COPYRIGHT 2008 CROSSCURRENTS PUBLICATIONS, LLC I hope you have enjoyed your visit and please return again. If you know anyone who might be interested in seeing what we have to offer, we'd be happy to have them visit as well! Alan M. Newman, August 25, 2008 All information on this website is prepared from data obtained from sources believed reliable, but not guaranteed by us, and is not considered to be all inclusive. Any stocks, sectors or indexes mentioned on this page are not to be construed as buy, sell, hold or short recommendations. This report is for informational and entertainment purposes only. Persons affiliated with Crosscurrents Publications, LLC may be long or short the securities or related options or other derivative securities mentioned in this report. Our perspectives are subject to change without notice. We assume no responsibility or liability for the information contained in this report. No investment or trading advice whatsoever is implied by our commentary, coverage or charts. |
