|
CHART DATA AS OF APRIL 29, 2002 A SPECIAL REPORT BY ALAN M. NEWMAN, EDITOR LONGBOAT GLOBAL ADVISORS CROSSCURRENTS |
| Is it not astonishing that
the American public has not demanded a greater retribution for the frauds
perpetrated in the greatest stock market mania of all time?
Actually, it is not. Given that there is no evidence yet that the mania has conclusively ended, we should expect hopes to remain at least constant until such evidence is clearly visible. If anything, the events of the last few months prove beyond a shadow of a doubt how gullible we all have been and how accommodating we were, and still are. Despite the enormous evidence of the largest scams in investment history, there is no furor. Enron and Global Crossing have quietly slipped into the background. Will the apology of Merrill Lynch's Chairman for his firm's blatant abuse of their client's trust also quietly slip into the background? Will punishment for the greatest excesses in greed ever extend beyond investor's portfolios to those who misled investors purposely? Perhaps not. Only time will tell. The pain of admitting the U.S. capital markets were capable of such deceits may be too much for authorities to accept. Capitalism cannot afford to be wounded after the erasure of so many trillions of dollars from the markets. Incredibly, the only wounds that may be acceptable are those that occurred to investor's portfolios. And only time will heal those wounds. The last secular bear market lasted 16 years (1966-1982). It took that long to heal the wounds from the prior excesses. We expect that as much
as a decade will be required
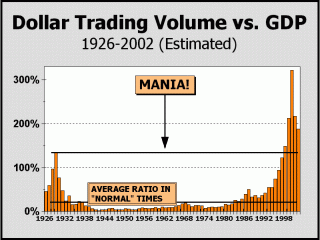
Dollar Trading Volume continues at levels that imply the stock market mania is ongoing. Although there has been a dramatic drop in the velocity of dollars traded, activity is still brisk on all levels and hope in the immediate future remains the focus of most investors. Versus GDP, trading activity has plunged by 42% from the heights achieved in 2000, but even this markedly subdued level of activity is 40.8% higher than in 1929. Perhaps Alan Greenspan is correct and one can only discern a mania by looking in the rear view mirror, but if that is so, we can certainly make the case for madness in today's market. Clearly, 1929 represented the peak of a former mania for stocks. Equally clear, our pictures show that the year 2000 represented a much larger - and astonishing - peak in mass hysteria. Strangely, the recognition that there was and is a mania in the present time is still lacking; there has been virtually no admission by the major Wall Street firms that this was the circumstance. Of course, there is likely never to be an admission, which would make many professionals and the firms that employ them complicit fools in this human tragedy. The best we may yet be able to hope for is the apology of Merrill Lynch Chairman David Komansky for the firm's culpability in luring their own clients to the "crap" their analysts were recommending. Time will tell. Eventually, we expect
that history will testify to the events of the last few years,
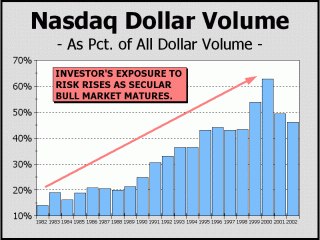
Even now, Nasdaq has not been abandoned despite a 70% loss in the price of the Composite Index. As a percentage of total DTV, Nasdaq still trades at a level that exceeds each year except 1999-2001. One would think that such a staggering price decline would be met by a wholesale exit from the arena by the players, but emotions have been conditioned by too many prior instances of recovery for the players to remain away for very long. As a result, average daily volume has fallen by only 12.6% since the March 2000 Nasdaq peak. Since total Nasdaq DTV is off a much larger percentage, it is clear that trading is now focused on lower priced stocks. The continued high level of activity seems quite unreasonable given that the entire Nasdaq Composite no longer has any earnings. As well, research has conclusively shown that the lower stocks are priced, the lower they tend to go (see Crosscurrents, April 29th issue). Given our stance on the likely length of a secular bear market now in progress, we believe interest will wane substantially for stocks and especially for Nasdaq. Investors will at some point, likely tend towards investing only in stocks with earnings and especially stocks with dividends, to reward them while they wait out the bear market. The ratio of Nasdaq DTV to total DTV should decline over time, perhaps back to well below the 30%-35% level of a decade ago. Eventually, total DTV should decline to between 50%-60% of GDP before the birth of a new secular bull market. For this to occur, volume and/or prices must decline significantly. This is how secular bear markets unwind; interest ebbs significantly causing interest to ebb still further, which causes interest to ebb still further. From 1968 to 1974, DTV as a percentage of GDP trended down by 59.4%. From 1987 to 1990, DTV as a percentage of GDP trended down by 37.4%. These were relatively
modest declines in activity.
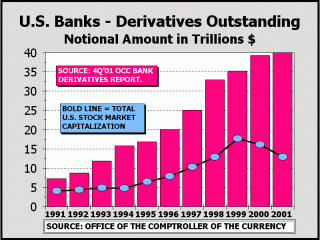
Much of the following commentary appeared in the April 8th issue of Crosscurrents. We feel it is important for us to reiterate these views and disseminate this article as widely as possible. From a benign birth only 20 years ago, derivatives have grown at a pace that suggests no end to increasing worldwide liquidity and near zero potential for worst case scenarios. According to the Bank of International Settlements, the worldwide total of derivatives have reached $119 trillion (that's 119 followed by twelve zeros), an amount equal to more than eleven times our own GDP. Although the market for derivatives has expanded at an extremely rapid rate, there has been ample doubt registered that this market can continue to accommodate the rapid pace of growth. In the case of Fannie Mae ("FNM"), which currently has more than $500 billion in outstanding derivatives contracts, the Office of Federal Housing Enterprise Oversite has questioned whether the derivatives market is "large enough and liquid enough" to accommodate FNM's growth. The Agency uses derivatives to offset interest rate risk. The term "offset" is used widely to describe the hedging of undesirable aspects of a portfolio, with the undesirable aspect "offset" and sold to a counter party. "Sold" is actually the wrong term, since typically the hedger is paying another party to assume the risk portion of the portfolio it does not want. This is how FNM can "offset" interest rate risks, how credit card companies can trade away the risk of an economic downturn and how institutions can protect against a stock market decline. However, these are mere suppositions! In 1987, they called it "portfolio insurance." But what "portfolio insurance" clearly proved is that risk in all markets remains inviolably intertwined with that market. Risk cannot be removed from any closed environment and remains "systemic." Even if one party passes on its interest rate risk or downside stock market exposure to a hundred counter parties, the risk remains in the system and does not go away. In the case of FNM, they (and presumably their counterparties) now suffer the interest rate risks of $500 billion. The worldwide financial system now suffers the counterparty risks entailed by $119 trillion of notional values in derivatives contracts. It has been our theory for years that a worst case scenario will probably only impact about 2% of any market. But in 1998, Long Term Capital Management's exposures impacted a total of $2 trillion in the derivative daisy chain, far more than expected and the reason why the Federal Reserve acted so forcefully to end the crisis. Make no mistake, the crisis was forcefully brokered to closure. However, as derivatives grow in size, thus must the worst case scenario. As the Fed has so brilliantly proved in the past, liquidity can be bought and liquidity can be maintained. What we do not know is whether the Fed's solution can or will always work. Frankly, we believe a point must be reached at which their accommodation must fail. Our logical assumption is based on the growth rate of risk: the more effective derivatives appear to be, the more risk will be created to be "laid off." Overall then, counter party risks must necessarily be on the rise and those risks must continue to increase as derivatives proliferate. Ironically, many of those banks that are trading off risk are the counterparties in other contracts, so that the notion that risk has been traded off is totally transparent! If an entity is on different sides of different transactions, nothing at all has been laid off and the entity's risk remains constant throughout their overall exposure. Risks have simply been traded for other risks. However, since the system appears to work, the only "benefit" has been to increase confidence that it will continue to work! Even the best laid plans are backed only by confidence in the system. A system supposedly unburdened by laid off risk is still a system potentially burned by counter party risk. At this juncture, risks appear to be enormous.
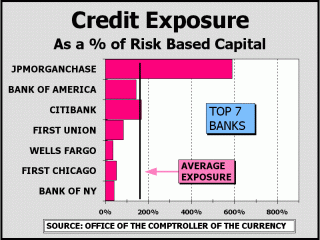
Clearly, the seven top U.S. banks have exposures far in excess of their own capital. As our chart shows, total assets of these banks are mere fractions of the notional values outstanding. Although we would never expect more than a very small fraction of notional values to impact these assets, that fraction could conceivably nevertheless wipe out assets entirely for some of the larger banks. Given the system relies on confidence, we fail to see how confidence can be enhanced by such exposures. The mania for derivatives is clearly intact.
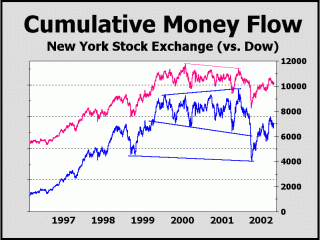
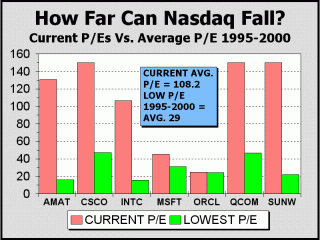
Our measurement of Cumulative Dollar A/D volume is modified by price to some extent and in our view, presents a fairly accurate illustration of inflows and outflows for the New York Stock Exchange. Beginning in the late spring of 1999, movement for both the Dow and our cumulative measure of inflows began to shift to a broadening sideways track, indicating that supply was beginning to overtake demand. In fact, the top trendline on each measure shows a divergence into 2001 as price moved modestly lower while inflows moved modestly higher. At that point, it was quite evident that supply had overtaken demand by a wide margin. The bounce since the September 2001 selloff appears to have concluded, meaning the next stage of the bear market may be about to get underway. With the traditional November to April positive period for stocks at an end, the logical inference is for another leg down for this measure. Regarding the seasonal effects just mentioned, stay tuned for the next issue of Pictures of a Stock Market Mania, which will highlight this phenomenon (coming in mid-June). About a year ago, we showed almost the identical chart in the Crosscurrents newsletter, asking "How far could Nasdaq stocks fall?" Then, we compared the current P/E reading with the lowest readings available from 1995-2000. Today, we compare the current reading with the average P/E ratio for these household names during the period 1995-2000. Over the last year and change, earnings for these issues have collapsed to an alarming degree and would have to surge by 273% just to achieve the 5-year norm registered from 1995-2000. Of course, if the economy remains punk as a secular bear market unfolds, earnings could remain under pressure and then prices would have to sink for P/Es to return to the "norm." However, even if earnings doubled from here, a decline to "average" P/Es would still place Nasdaq down about 46.4% from current levels. What if the secular bear market theory became fact.....and with interest in stocks dwindling, Nasdaq were to decline to the lowest P/E levels registered in recent years? Don't ask! Even if earnings tripled from here, Nasdaq would decline by 57.3%!
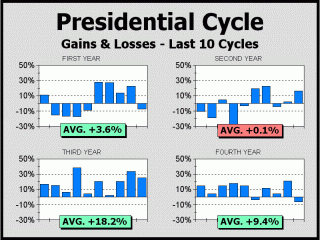
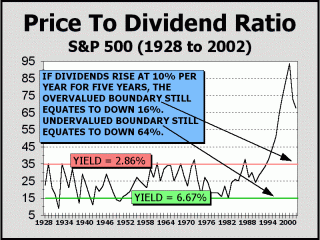
The Presidential Cycle has been one of the more reliable methods of gauging overall risk levels in the stock market. Although we are showing only the last ten cycles here, the third year of the Presidential Cycle has been positive in the last 13 cycles and has averaged an 18% gain, one of the reasons we are actually considering a shift to a bullish stance for 2003 (at some point later in the year and likely from much lower price levels). The second year of the Presidential Cycle witnessed significant gains in 1954 and 1958 but has been a downer since, and has been the only year of the cycle to show an average loss in the last ten cycles. Given our stance of a secular bear market in force, it is difficult to see how the traditionally weak second year of the cycle might accommodate better results this year. Indeed, a down year consistent with the past ten cycles would not necessarily mean a disaster, and would be satisfied with the Dow Industrials under 10021, the S&P 500 under 1148 and Nasdaq at under 1950. Incredibly, those numbers would actually represent a substantial improvement from today for both the SPX and Nasdaq. Since the market's favorable seasonal period has now concluded, those numbers may also represent the best case scenario for the remainder of the year. The bad news is that dividends are still way out of whack with what history has clearly shown is a fair return for long term investors. Given six months of the year are a non-event for investors (see our article on seasonal effects in early June), dividends are required to coerce investors their best policy is to sit still. However, the 1990's saw a larger rationale come to the fore. With corporate bigwigs able to take advantage of shareholder largesse in the form of stock options, the impetus was to withhold dividends in the favor of boosting earnings as much as possible. Higher earnings meant higher share prices and loftier gains for stock options. The supposition was that shareholders would not mind trading dividends for higher share prices. And until the scam was up, they did not. Unfortunately, share prices were lifted by any means possible, including some that were unethical and illegal. Now that prices have collapsed back to semi-reality, shareholders have been left holding stock that yields little more than one-third the historical average. We must now expect that dividends will once again return to a position of importance in investor portfolios. If dividends are raised 10% per year for the next five years, a move back to traditionally overvalued levels will still result in a decline of 16% in prices. A move to traditionally undervalued levels
But there is better news. Owing to the magic of compounding, if dividends rise at a rate of 10% per annum for a full decade, a move back to traditionally overvalued levels would result in a rise to 1444 for the S&P 500, about 35% higher than than today and a pace of just over 3% annually. Unfortunately, a move to undervalued levels is always possible and such a journey would see the S&P 500 trade down to 619, another 42% lower than today.
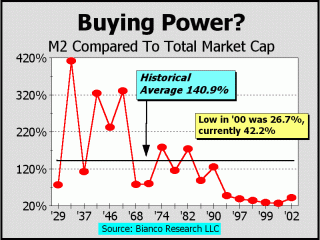
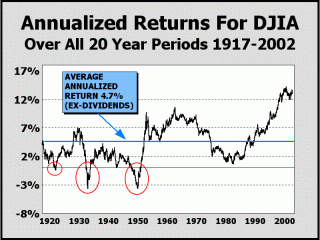
The M2 measure of money supply versus total stock market capitalization remains mired essentially where it was for much of last year, at about 42%. According to research done by Bianco Research LLC, M2 compared to market cap has averaged close to 141% going all the way back to 1925! The all time low reading was achieved in March 2000 at 26.7%. The March 2000 and current readings are still evidence of intense interest in stocks, far exceeding the interest shown in stocks at prior secular peaks in optimism in August 1929, November 1968 and December 1972, when M2 ranged from 76.7% to 79.8% of market cap. Prior lulls in interest were recorded in September 1974 at 174.5%, June 1949 at 325.6% and June 1932 at 412%. A return to even the lowest of these numbers would represent a staggering exodus of investors from the stock market, but under the present circumstances where the trust of small investors has been thoroughly trashed by corporations and financial firms, this could easily turn out to be the case. If we assume constant and very rapid money supply growth of 12% per annum for the next decade, even a return to the historical average of 140.9% would be sufficient to take the Dow down about 7% from current levels. If money supply only grew by 10% and this indicator returned to the levels of 1974 in ten years, the Dow would trade about 37% lower than now. Twenty year annualized returns for the Dow are still in the stratosphere and precisely illustrate just how emphatic the mania for stocks has been. At the peak of 14.2% achieved in March 2000, investors were totally convinced similar 20-year returns would be possible for the remainder of their lifetimes, despite the fact that this had never before occurred. No one bothered to even do the math surrounding such a circumstance, which would mean that anyone who was capable of saving a mere $5000 every year would have one million dollars in savings in less than 26 years. In a society where such riches were possible, either of two scenarios would eventuate. Either demands for goods would rise so sharply that inflation would reduce the value of the savings or so many people would retire prematurely that the labor market could demand any price and thus reduce the value of savings. Simply put, there can be no free lunch. The rapid incline in annualized gains illustrates the power of a veritable mania for stocks. Taken back to where our chart begins in 1917, the twenty-year annualized average return for the Dow Industrials ex-dividends has been only 4.7%. In fact, if we remove only the time since Alan Greenspan's remarks about "irrational exuberance" in December 1996, returns averaged only 4.15% to that date. Removing the influence of the years since the time the Dow last traded below 4000 in March 1995, 20-year returns were only 4.04%. Removing the influence of the years going back further still, to the last time the Dow traded below 3000 takes the 20-year return to 3.9%! More often than not, 20-year annualized returns have been a lot lower than the current average - in fact, 53.7% of all weeks on the chart witnessed 20-year returns of less than 4.7%. And if we were to extrapolate an eventual return to this average occurring ten years from today, the Dow would stand at 8436, fully 16% lower than it is today! Time will likely see returns fall to "average."
In conclusion, although evidence continues to pile up about abuses and outright frauds that fueled the mania for stocks, there are ample reasons to expect a rapid catharsis for the U.S. stock market will not occur. Although the system that allowed abuses and frauds to proliferate needs purging, the Federal Reserve, the federal government and the financial industry have a vested interest in maintaining the public confidence in our capitalist system. As a result, we expect that the system will only slowly change to accommodate fair treatment for investors. However, the damage that has been done is now part of history and will not be easily forgotten. It took until 1932 for America's investors to realize just how hoodwinked they had been. And it took another 23 years before the Dow traded higher than it did in 1929. Can investors recover from the shocks of the mania and the abuses suffered at the hands of the very corporations they invested in and the institutions and analysts that recommended them, even when those investments were considered "junk" and "crap?" Yes, investors will recover. As they did from the excesses in the Roaring Twenties, and as they did from the excesses of the Nifty-Fifty. When......? Only time will tell.....
A small portion of the charts and analysis presented here are shown in our newsletter weeks and months in advance of their appearance on this site. If you haven't already, we urge you to take advantage of our FREE 3-issue trial (see link below). We hit our targets for both 2000 and for 2001. Some time ago, we said "The September 21st low was very likely the low for the year [2001]....we believe the SPX could trade as high as 1249 (1177 much more likely) before the end of the year." We pretty much nailed the top print which came in at SPX 1173.62 on December 5th and actually called for a December 6th high in our newsletter. As it turns out, the high since the September low has been 1176.97 registered on January 7th, only .03 from the "much more likely" high we had initially pegged. Our upside and downside targets for 2002 remain the same as from our last update, but our odds have been altered to reflect the action of the last two months. Our downside targets
for 2002 are as follows (at least 2 in 3 odds):
Our best case scenario
for 2002 is as follows (very low probability):
Alan M. Newman, April 30, 2002 All information on this website is prepared from data obtained from sources believed reliable, but not guaranteed by us, and is not considered to be all inclusive. Any stocks, sectors or indexes mentioned on this page are not to be construed as buy, sell, hold or short recommendations. This report is for informational and entertainment purposes only. Longboat Global Advisors, Alan M. Newman and or a member of Mr. Newmanís family may be long or short the securities or related options or other derivative securities mentioned in this report. Our perspectives are subject to change without notice. We assume no responsibility or liability for the information contained in this report. No investment or trading advice whatsoever is implied by our commentary, coverage or charts. |
